Plotting Results
You create plots to monitor the CFL Number, the time-step, and the total mass of water of the simulation. To verify the quality of the simulation, you create a plot to monitor the Mass Conservation Error report and monitor the iteration error for the conservation of mass in the water phase.
The CFL Number plot lets you check that the CFL number is maintained at an appropriate level. The target value of 2 is not a global limit, as the estimate of the Free Surface Implicit Multi-Step time-step provider is based on the flow field and mesh from the previous time-step, while the CFL number report evaluates the CFL number on the current mesh and solution. However, the CFL number should remain within reasonable limits. The Time-Step plot should show some correlation with the CFL Number plot, in that the time-step decreases as the CFL number increases.
The Mass Conservation Error lets you check that the water phase is conserved as the simulation proceeds, and that numerical errors are minimal.
- Right-click the Reports node and select .
- Rename the Maximum 1 node to CFL Number.
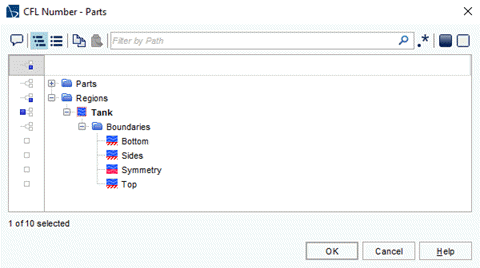
- Select the node and set Field Function to Convective Courant Number.
-
Set Parts to .

- Create another Maximum report and rename it to Time-Step.
- Select the node and set Field Function to Time Step.
- Set Parts to .
- Multi-select the CFL Number and Time-Step nodes. Right-click the selected nodes and select Create Monitor and Plot from Report.
-
In the Create Plot From Reports dialog, click
Multiple Plots (one per report).
The new monitors and plots are created.
- Right-click the node and select .
- Rename the User Field Function 1 node to Water Mass.
-
Select the Water Mass node and set the following properties:
Property Setting Function Name WaterMass Dimensions Mass Definition ${VolumeFractionWater}*${DensityWater}*${Volume} - Create a Sum report and rename it to Water Mass.
- Select the node and set Field Function to Water Mass.
- Set Parts to .
- Right-click the Reports node and select .
- Select the node and set Phase to Water.
To create a cumulative monitor and plot of the phase mass conservation error:
-
Right-click the report and select Create Cumulative
Monitor and Plot from Report.

- Save the simulation.