Analyzing the Results
View the final scenes and plots, and interpret the results of the simulation.
-
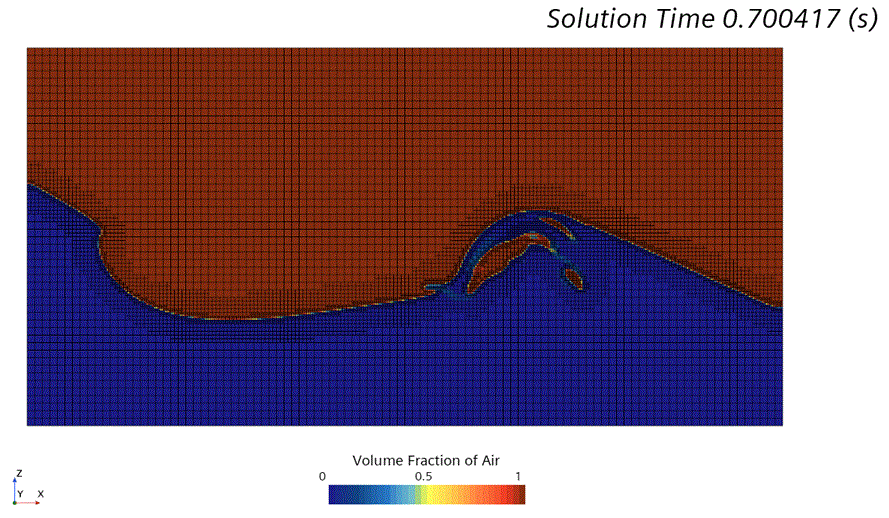
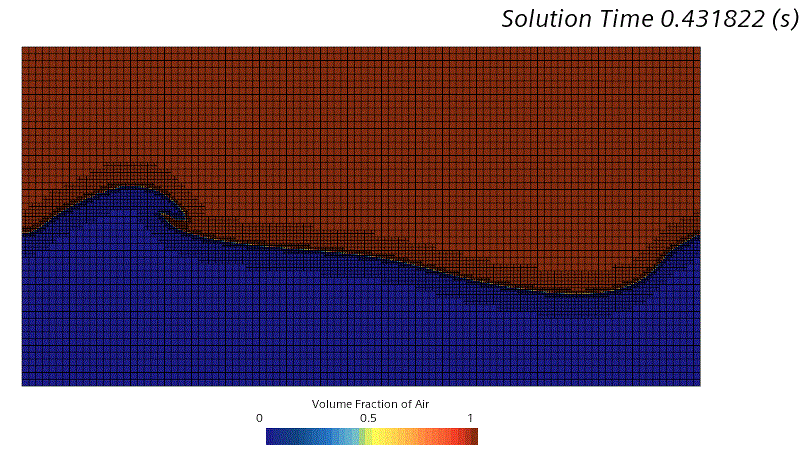
View the Volume Fraction scene.
The interface is sharp and you can see some small features such as bubbles and droplets that are well-resolved in the refined mesh.
-
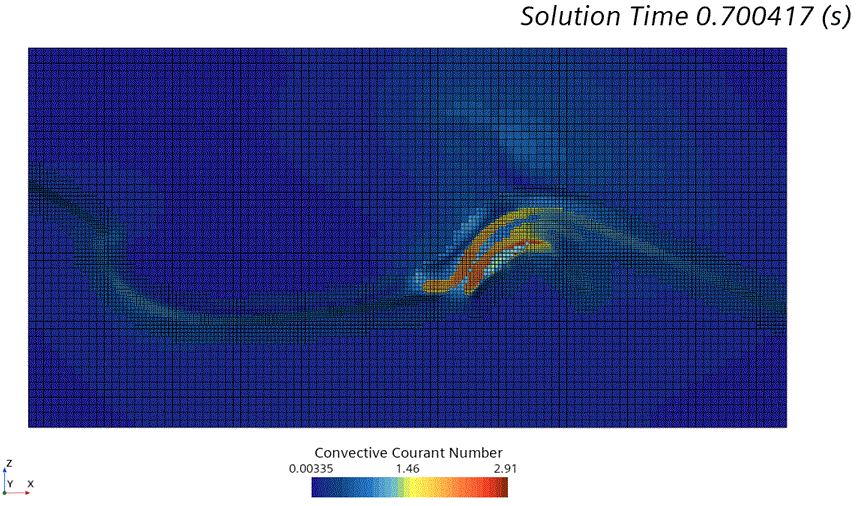
View the CFL Number scene.
The CFL number is close to 2 throughout the domain, and is highest near the interface, as expected.
-
Examine the CFL Number plot.
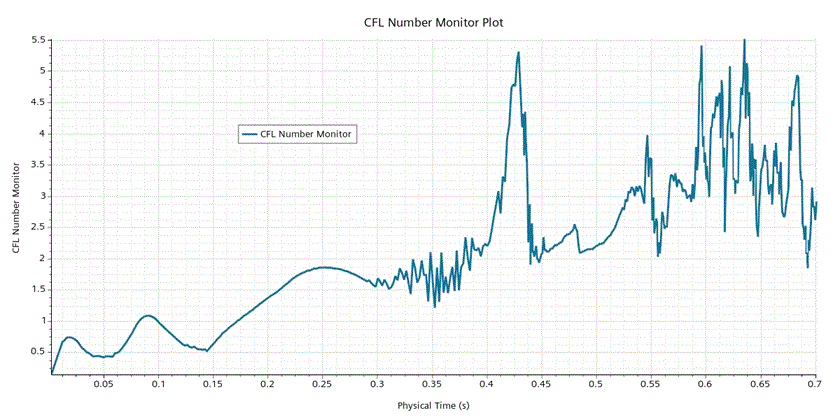
The higher peak CFL number values are often seen away from the interface, or in time-steps where the flow structure is changing rapidly. For example, at about 0.445 seconds, a small wave-like feature can be seen.
-
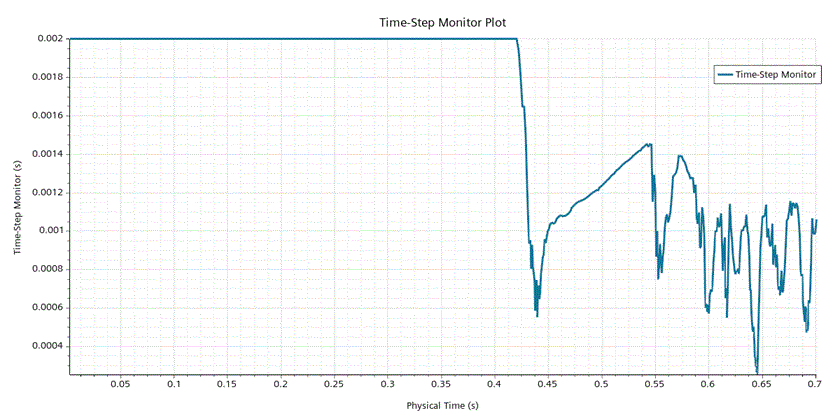
Compare the Time-Step Monitor plot with the CFL
Number plot above.
The time-step was stable at 0.002 seconds (the maximum value) until the CFL number increased towards 2. Adaptive time-stepping then reduced the time-step to control the CFL number at appropriate values.
-
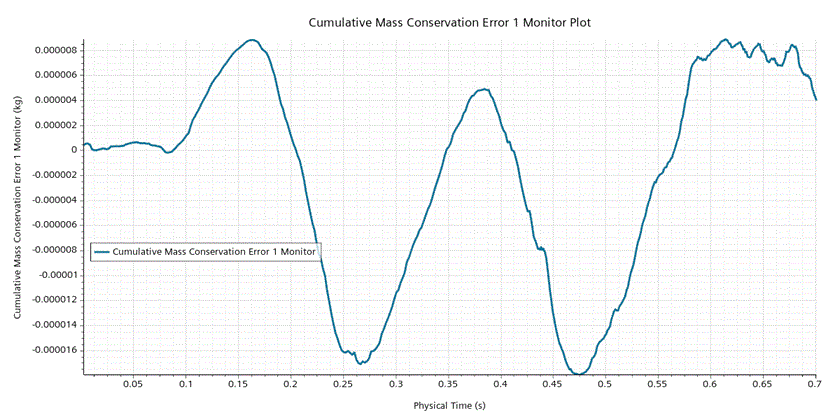
Examine the Cumulative Mass Conservation Error 1
Monitor plot and note the maximum value of the curve, which is
approximately 8e-6 kg. By comparing this value with the
initial total mass of water (0.99756 kg) that you
obtained from the Water Mass report at the start of the
simulation, you can estimate how well mass is conserved. You calculate the mass
loss for this simulation as
, which verifies that the water mass is well
conserved.
