Visualizing the Results
Create a scalar scene to view the results of the simulation.
The main result of interest in this tutorial is the erosion rate across the restrictor surface. A scalar scene can be created showing this profile.
To visualize the results:
- Right-click the Scenes node and select .
-
Open the node and select the node.
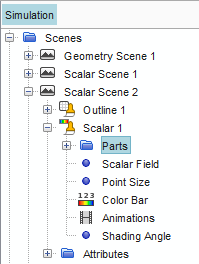
-
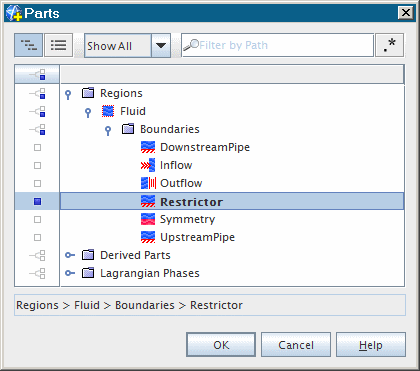
Set
Parts to
.
- Continuing within the same Scalar 1 node, select the Scalar Field node.
- Set Function to Erosion Rate.
- Select the node and clear the Outline property.
The view can be initialized using
 (Save-Restore-Select Views).
-
Click
(Save-Restore-Select Views) and select from the pop-up menus.
-
Select the Color Bar node and set the following:
Setting Value Orientation Vertical (Set before setting Width and Height.) Width 0.1 Height 0.7 Position [0.7, 0.1] 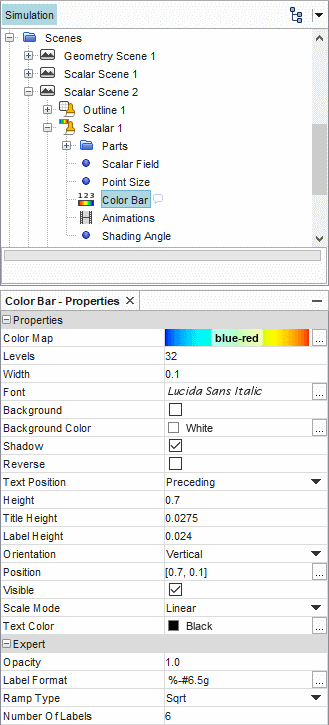
-
Use
 (Rubberband Zoom) and mouse controls to zoom in on
the eroded restrictor surface and position it as shown below.
(Rubberband Zoom) and mouse controls to zoom in on
the eroded restrictor surface and position it as shown below.
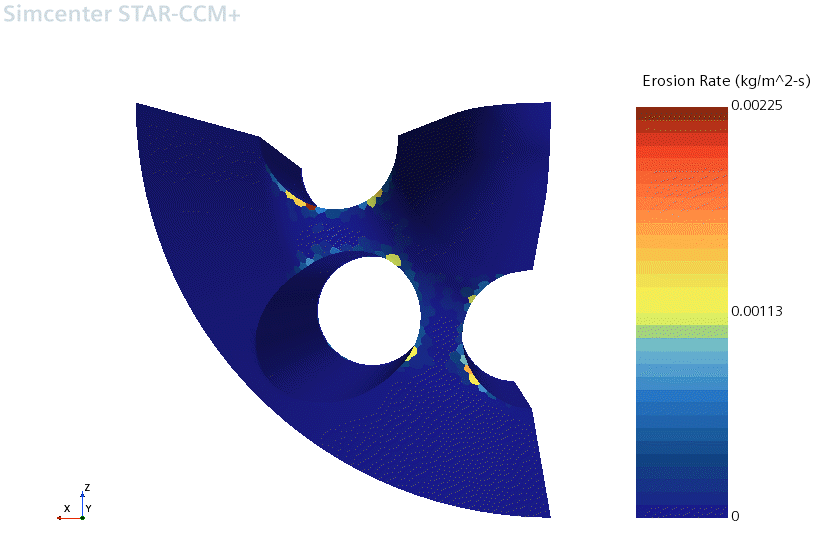
The plot shows where the maximum erosion rates are expected.