Collision and Coalescence
Simcenter STAR-CCM+ uses a host cell approach to detect collisions. Two parcels can collide only if they are in the same cell. Simcenter STAR-CCM+ uses the faster of the following collision algorithms to detect collisions in any particular cell. The following algorithms are available:
After a collision is detected between two droplets, different collision outcomes are possible: bounce, coalescence, reflexive separation, and stretching separation (grazing collision) [659]:
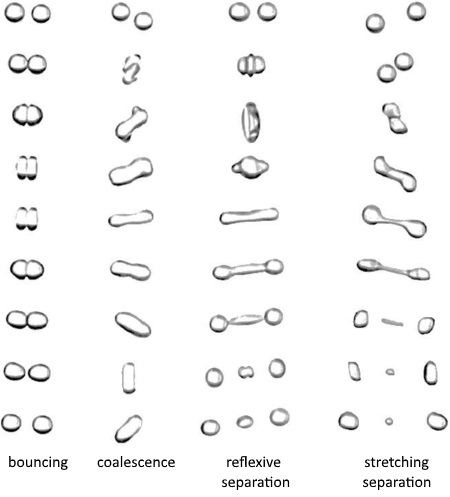
This implementation ignores the formation of satellite droplets which may occur at high collision Weber numbers.
Collision outcomes are described by three non-dimensional parameters:
- The collision Weber number
is:(3142)
where is the average surface tension of droplets 1 and 2 and is the average density. The relative velocity is:
(3143)where and are the velocities of the colliding droplets, and and are their corresponding radii.
The collision Weber number can also be defined based on the diameter of the smaller droplet , which in relation to is given as:(3144) - The impact parameter
is:(3145)
where is calculated by taking the distance from the center of one droplet to the relative velocity vector that is placed on the center of the other droplet. When , the collision is head-on. When , the droplets barely graze each other.
- The droplet size ratio
is:(3146)An additional size ratio parameter commonly used in literature is .
- The collision Ohnesorge number
is defined as:where is the averaged dynamic viscosity of the colliding droplets.
The outcome of a collision can be represented with a collision outcome map based on the impact parameter and the collision Weber number . Droplets bounce off each other (simple bounce or reflexive separation), coalesce, or graze each other (stretching separation) according to their position on the collision outcome map. The general shape of the curves can shift with differing size ratio parameter as well as other physical properties such as droplet viscosity.
Three collision outcome maps are implemented in Simcenter STAR-CCM+ . The O'Rourke map ([678], [671]), the Ashgriz map ([645]), and the Composite map.
The O'Rourke and Ashgiz maps plot the collision efficiency versus the collision Weber number which is calculated by Eqn. (3142) for each pair of interacting droplets based on an averaged droplet diameter. The collision efficiency is defined as the probability of obtaining a given outcome ( ). The effect of energy loss due to viscous dissipation is not included in either of these two maps.
- O'Rourke Map
- The O'Rourke Map accounts for bounce,
coalescence, and stretching/grazing separation modes.

- Ashgriz Map
- The Ashgriz map accounts for coalescence,
reflexive separation, and stretching/grazing separation modes.

The boundaries of the coalescence area are described by the curves and or and .
For each curve:
where , , and are empirical constants that are used to fit the curve to the data.
The default values for these constants are:
| O'Rourke | Ashgriz | |||
|---|---|---|---|---|
| -1.0 | ||||
| 1.0 | 1.0 | 1.0 | 0.005 | |
| 0.0 | 0.0 | 0.0 | 20 | |
The droplet diameter ratio correction is defined as:
where is the droplet size ratio. The default values for the constants are:
Using the default values for O'Rourke listed in the previous table, Eqn. (3147) for and reduce to these formulations for collision and coalescence:
The O'Rourke algorithm for overall collision dynamics is described in the following flowchart [671]:
is a random number in the range [0,1].
For both O'Rourke and Ashgriz methods, if coalescence occurs, the number of coalescences that each droplet undergoes is determined by finding the value of for which
where is the probability of collisions given by Eqn. (3176).
When coalescence occurs, the number of droplets from the less populous parcel is subtracted from the more populous parcel. If the outcome is grazing collision or bounce, only one collision is calculated per droplet. The post-collision velocity, temperature, and mass of the droplets are calculated based on the conservation of mass, momentum, and energy.
- Composite Map
- The Composite map provides models for the three boundary curves. The Sommerfeld
model for bounce, the Suo-Jia model for stretching separation, and the Ashgriz
model for reflexive separation.

Grazing Collisions
The threshold condition for grazing separation is for the O'Rourke method or for Ashgriz. On the assumption that droplets retain their original size in grazing collisions, the new velocities of the droplets are:
where and are the masses of the more and less populous parcels respectively.
Satellite droplet formation is ignored in grazing collisions. One collision is calculated for each droplet. The velocity of the more populous parcel is updated to account for droplets that did not take part in the collision:where and are the numbers of particles in the more and less populous parcels respectively.
Bouncing
The threshold condition for bouncing is .
The new velocities of the bouncing particles are given by:
As in the case of a grazing collision, the velocity of the more populous parcel is updated to account for droplets that did not take part in the collision.
Reflexive Separation
The threshold condition for reflexive separation is .
The new velocities of the droplets after reflexive separation are:
is defined from the equation for the curve ():
NTC Detection Algorithm
The NTC model uses two algorithms for detection parcel collisions. By default it uses the NTC detection algorithm, but when parcel density becomes high, it switches to the O'Rourke detection algorithm.
The NTC algorithm is more efficient for a large number of parcels in sparse sprays. NTC considers only a sample of collision pairs but scales up the collision probability so that each pair is more likely to be selected. On average, the result is the same as if the full distribution was modeled directly.
If a cell contains droplets, the expected number of collisions in the cell over a time interval is given by summing the probability of all possible collisions:
where:
- is the relative velocity between two colliding parcels
-
is the collision cross section of the two
droplets defined as(3168)
- is the time-step size
- is the cell volume
- is the number of parcels in a cell
- is the number of droplets in parcel .
The factor of one-half is a result of symmetry. This summation can be modified by pulling a constant factor outside:
The value of is used for scaling the selection probability of a collision. The chosen value is sufficiently large so that the following restriction holds
It is assumed that a representative subsample of parcels may be randomly selected from the set of parcels in the cell. This statistical approximation allows a constant multiplier to reduce the limits of summation as follows:
where
The overall cost is proportional to the product of the limits of the summation, namely . The value of is linearly proportional to , because goes as . The double summation is evaluated using an acceptance-rejection scheme. The number of candidate pairs () is selected randomly from the cell population.
After a pair has been selected, a random number from a uniform distribution (from 0 to 1) is used to determine if the candidate pair actually collides. A new random number is chosen for every pair, even for pairs within the same cell. A collision takes place between parcels and if the deviate satisfies the inequality
The variable represents the greater number of droplets between and . If the collision is accepted, then , the lesser number of droplets, actually participates in the collision. This distinction is important in the case of droplet coalescence, where one parcel of droplets absorbs the other. Whenever employed for a given cell, the NTC algorithm is linearly proportional to .
If the spray is so dense that , then direct calculation of collisions using the O’Rourke approach is more efficient than the NTC algorithm for this cell. Simcenter STAR-CCM+ then switches to the O’Rourke algorithm automatically.
O’Rourke Detection Algorithm
The O’Rourke collision detection algorithm is a direct technique because it considers all possible collision partners. Compare to the NTC detection model, which samples collision pairs and scales the collision probability according to the results.
The probability of any droplet colliding with any other droplet is given by
The mean expected number of collisions between a droplet in parcel and the droplets in parcel is given by
The number of collisions is determined by sampling from a Poisson distribution with a mean of :
Eqn. (3176) gives the probability of collisions. gives the probability of zero collisions. Thus, whenever employed for a given cell, the O’Rourke approach is proportional to .