Validating the Results
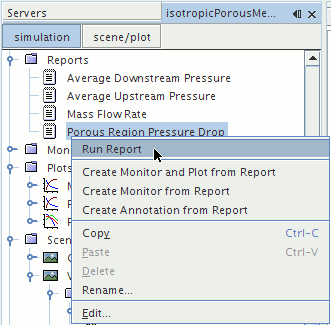
As discussed at the start of the tutorial, the calculated pressure drop across the porous region can be compared to the theoretical pressure drop derived from the mass flow rate.
-
Right-click the
>
node and select
from the menu.

The value produced by this report is displayed in the Output window as 138.59 Pa.
To determine the theoretical pressure drop:
- Right-click the report node and select .
The mass flow rate through the porous region is 2.91E-02 kg/s. Since the fluid density is 1.18415 kg/m3 and the cross-sectional area of the porous region 0.00786 m2, this corresponds to a superficial velocity through the region of 3.12 m/s. Putting this superficial velocity into Eqn. (245), with = L = 0.03 m, gives a pressure drop of 147.75 Pa across the porous region, which means that the calculated pressure drop is within 10% of the theoretical drop. This is acceptable because the theoretical pressure drop formula assumes a constant superficial velocity in the porous medium. In this comparison, you have used an average velocity value based upon the mass flow rate, implying that the theoretical value is only an approximation to the actual pressure drop.