Analyzing the Solution
The scenes show the solution for the final time-step within the specified time range of the simulation.
To analyze the results:
-
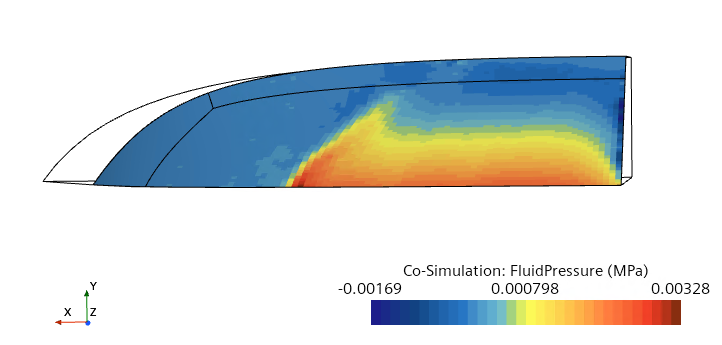
Select the Hull Fluid Pressure tab at the top of the
Graphics window. The following scene shows the mapped
fluid pressure applied to the hull:
-
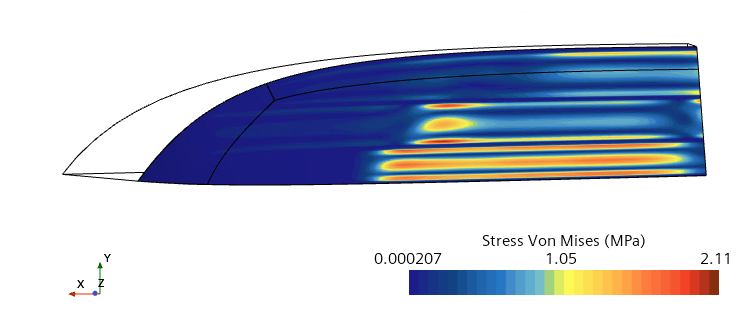
Select the Hull Stresses tab to display the Von Mises
stress:
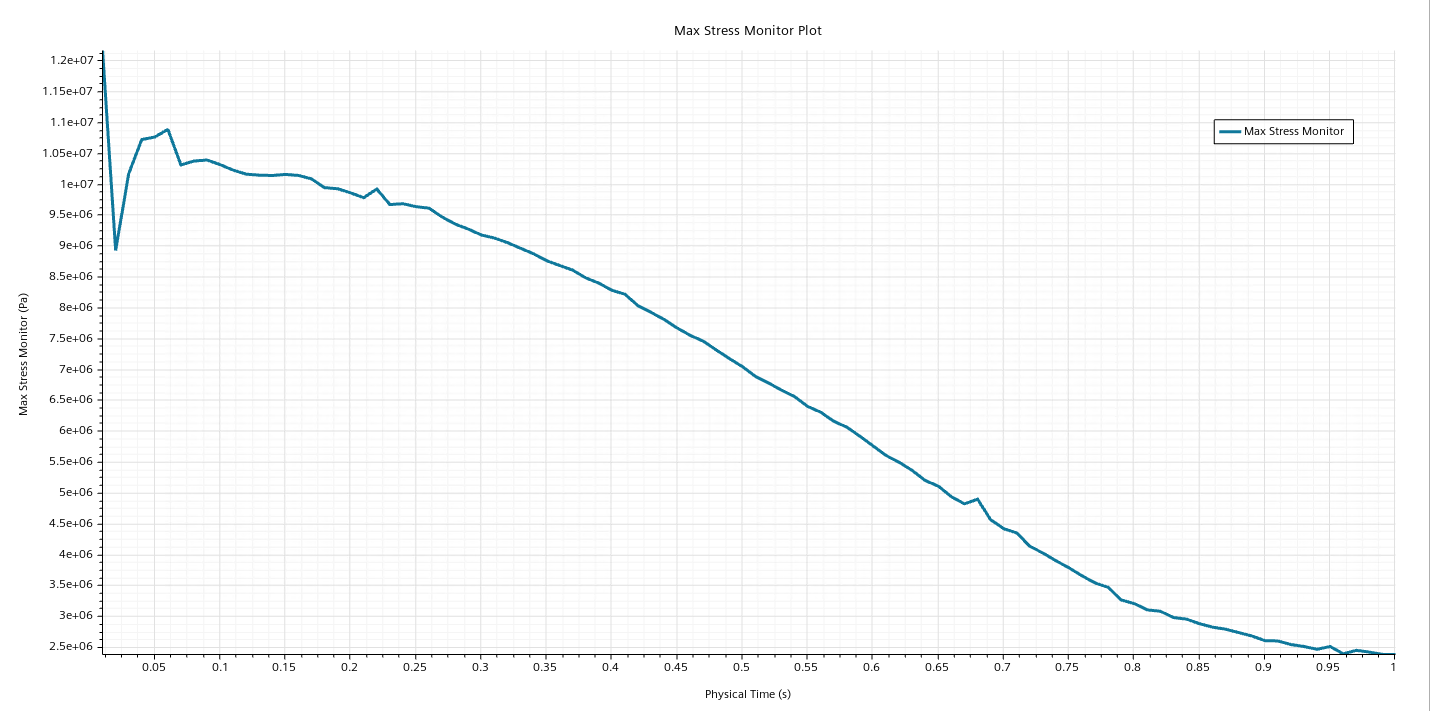
To view how the maximum Von Mises Stress through the hull changes with
time:
-
Select the Max Stress Monitor Plot tab.