Analyzing the Results
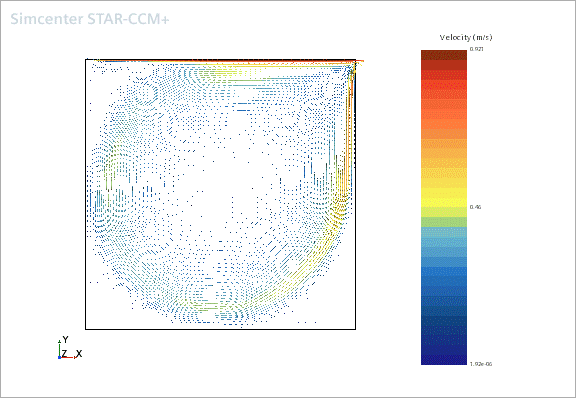
Once the calculations are finished, the displays show the results based on the pre-processing settings.
-
Click the
Vector Scene 1 display tab to view the vectors.

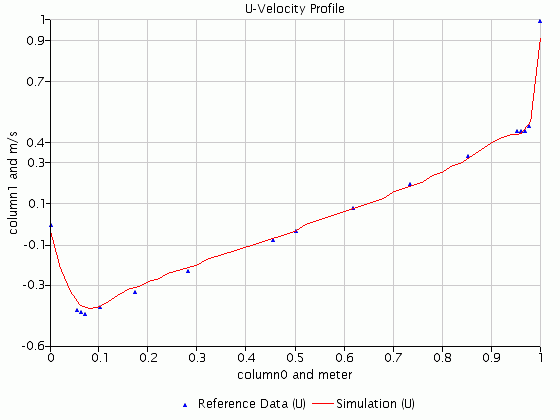
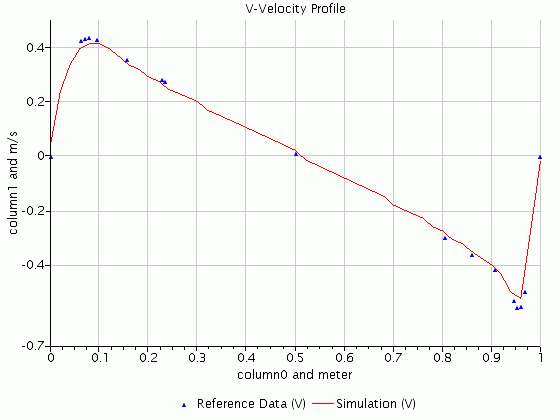
The plots also contain numerical results that can be compared to the experimental data:
-
Click the
U-Velocity Profile display tab:

-
Click the
V-Velocity Profile display tab:
