Setting Up Lines for Plotting
Data are plotted for both the U- and V-velocity profiles along line probes passing through the center of the cavity.
To create these lines:
- Make sure that at least one scene display is active in the Graphics window.
-
Right-click the
node and select
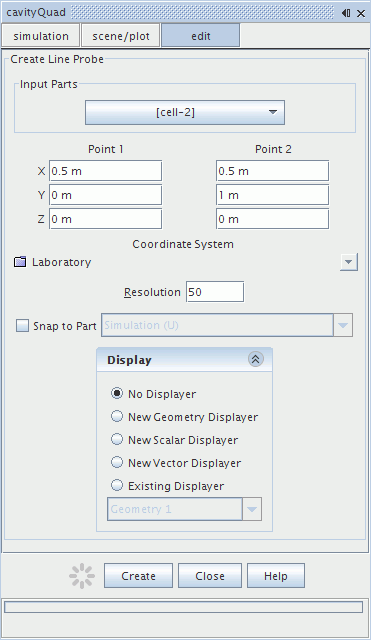
The Create Line Probe dialog appears in the Explorer pane to specify the desired line.

-
Set the following properties for the U line:
Property Value Input Parts cell-2 Point 1 [0.5, 0.0, 0.0] Point 2 [0.5, 1.0, 0.0] Resolution 50 Display No Displayer -
Click
Create, then click
Close.
A new derived part named is created in the manager node.
- Rename the node to Simulation (U)
Next, create the V line probe. This can be done simply by making a copy of the existing derived part and modifying it.
- Right-click the node and select .
- Right-click the node and select .
- Rename the new node to Simulation (V)
- Enter 0, 0.5, 0 for the Point 1 property.
- Enter 1, 0.5, 0 for the Point 2 property.
- Save the simulation.