Visualizing the Solution
Post-processing scenes can be updated every iteration (or time-step) in Simcenter STAR-CCM+. This allows for dynamic monitoring of various quantities, such as the velocity that you want to visualize in this tutorial. A vector scene is therefore created before running.
-
Right-click the node and then select .
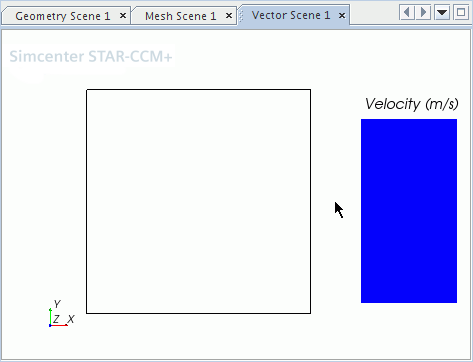
A new Vector Scene 1 display appears.
The vector bar shows the default setting of Velocity.
-
Click and drag the vector bar toward the right side of the display until it switches to a vertical orientation.

- The edges of the bar can be dragged to make the label larger. Move the square to make more room for the vector bar.
- To verify that the scene has the entire region selected for the data, select the node.
The Parts property shows cell-2, the name of the region.