Running the Simulation
Define the stopping criteria, then run the simulation.
-
Edit the Stopping Criteria node and set the following
properties:
Node Property Value Minimum Limit 1E-12 Minimum Limit 1E-12 Maximum Inner Iteration Maximum Inner Iterations 50 Maximum Physical Time Maximum Physical Time ${PeriodReport}/2 Maximum Steps Enabled Deactivated
-
Click
 (Run).
-
Open the and UMagAtPointProbe Plot nodes.
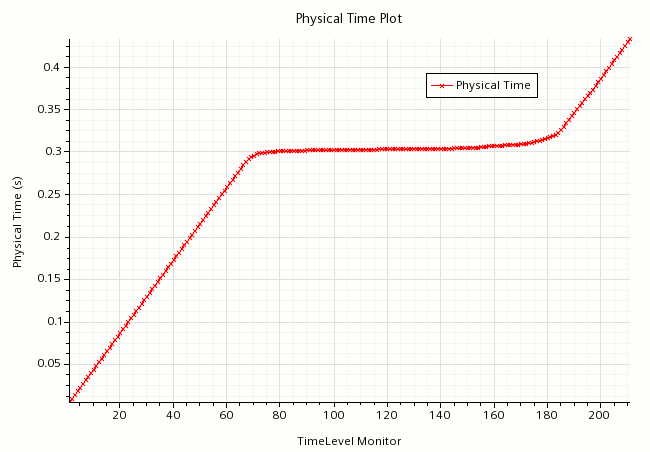
This plot shows the how the time-step changes with respect to the physical time. The time level counts the number of time-steps within the simulation. As you can see from the linear trends at the start and end of the simulation, the time-step remains constant. In those portions of the simulation the deformation has a similar rate of change. Between 0.29 s and 0.31 s, when the snap-through event occurs, the time-step must be reduced in order to capture the rapidly changing rate of deformation. This reduction in time-step results in a flattening of the curve.
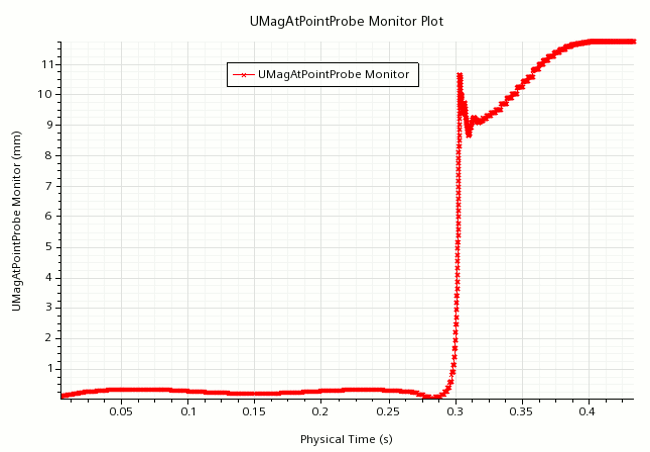
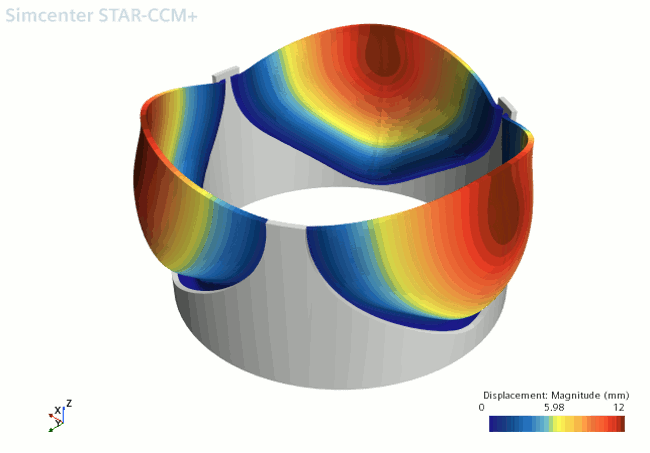
From the displacement magnitude plot, you can see that the leaflet undergoes minimal deformation under the pressure load when the load is first applied. At around 0.29 seconds (which coincides with the change in time-step) the leaflet valve experiences a large deformation over a very short time period (the snap-through event). Thereafter the valve exhibits a small amount of oscillation before settling at a maximum deformation of 11.75mm.
- Open the node.
-
In the Vis toolbar, click
 (Save-Restore-Select Views) and select .
- Save the simulation.