Running the Simulation
The setup is complete and you can now run the simulation.
-
Click the
 (Initialize Solution) button in the
Solution toolbar or use the
menu item.
(Initialize Solution) button in the
Solution toolbar or use the
menu item.
-
Click the
 (Run) button in the
Solution
toolbar to run the analysis.
(Run) button in the
Solution
toolbar to run the analysis.
The
Residuals display is automatically created and shows the solver’s progress. If necessary, click the
Residuals tab to bring the
Residuals plot into view.
At the end of the simulation:
-
Click the
Cylinder Wall tab at the top of the
Graphics window.
A cylinder wall scene similar to the one shown below appears.
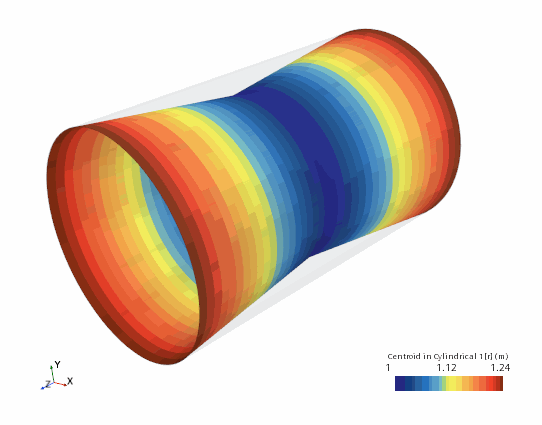
The cylinder would continue to contract if the simulation were run for longer, as no time limiting factor was built into the field function used to specify the grid velocity.
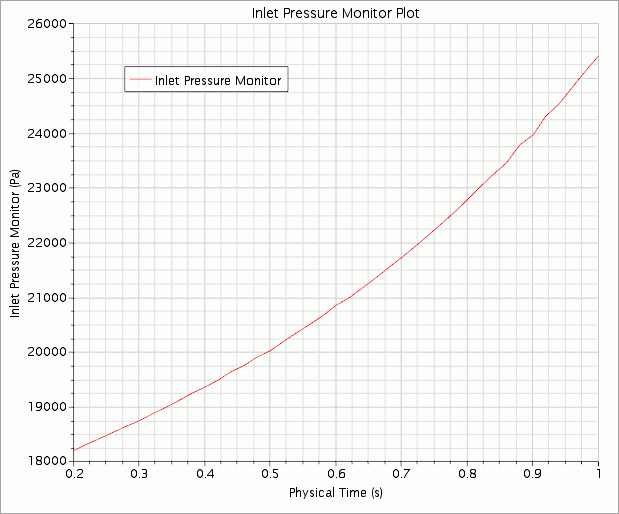
Modify the scales of the Inlet Pressure Monitor Plot to view the solution between 0.2 s and 1.0 s.
- Select the node and set Minimum to 0.2 and Maximum to 1.0.
-
Select the
node and set
Minimum to
18000.0 and
Maximum to
26000.0.
The resulting Inlet Pressure Monitor Plot is shown below.