Visualizing the Solution
View the temperature of the fluid and solid regions as the solution develops.
Start by creating a plane section part for display.
- Right-click the Derived Parts node and select .
-
In the
Create Section panel, set the following properties:
Property Setting Input Parts [Fluid, Solid] Plane Parameters origin: [0.5 m, 0.5 m, 0.5 m]
normal: [1 m, 0 m, 0 m]
Display Existing Displayer -
Click
Create and then
Close.
A node appears within the Derived Parts node: .
The plane section part can now be added to any suitable scene or be displayed in its own scene if desired. Create a scalar scene and display the plane section and other parts colored by the temperature scalar value.
- Create a scalar scene.
-
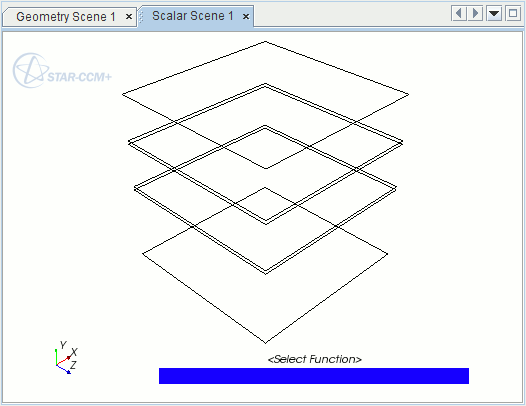
To zoom in and position the part as shown below, use the mouse buttons and click
 (Save-Restore-Select views) in the toolbar.
- Edit the node.
-
In the
Edit dialog, do the following:
- Click OK.
- Right-click the scalar bar in the Graphics window display. In the pop-up menu that appears, select Temperature.
- Look at the Scalar Scene 1 display to verify that it contains the thermal insulator geometry along with a color bar for temperature.
- Save the simulation.