Overset Mesh Field Function Reference
The following primitive field functions are available in the simulation with overset mesh. Both the volume mesh and the overset mesh representation can be used to display these field functions.
The volume mesh representation displays all of the active cells, and some acceptor cells in order to fill-in visualization gaps. If you want to use the overset field functions, such as Overset Cell Type, it is best to use the overset mesh representation.
| ChimeraGridTestData | Displays the interpolation error at the acceptor
cells. To calculate the interpolation error, Simcenter STAR-CCM+ interpolates a cubic polynomial function to all the acceptor cells. For an acceptor cell, the error can be a positive or negative value. 0 indicates perfect interpolation.  For other cell types, this function always returns 0, since no interpolation is done. |
| Overset Cell Status | Used internally as a flag in the solvers to identify the status of each cell during the solution process of the equations. This function provides more information about the result of the Overset Assembly process. The available values are:
|
| Overset Cell Type | Used by the Overset Assembly process to identify the status of each cell. It gives more information about the cells with regard to the Overset Assembly process. Can be used to analyze errors. The available values are:
|
| Overset Error Status | Indicates the status of each cell that has an error. The available values are:
|
| Overset Grid Area | Estimates the area of all regions in the simulation. For overset mesh simulations, this area estimation is more accurate than the area computation of the
Area field function, because it avoids double-summation of the area of overlapping cells in overlapping regions.
The Overset Surface Integral report uses this field function for a more accurate integration compared to the standard Surface Integral report. See Overset Surface Integral Report. |
| Overset Grid Volume | Estimates the volume of all regions in the simulation. For overset mesh simulations, this volume estimation is more accurate than the volume computation of the
Volume field function, because it avoids double-summation of the volume of overlapping cells in overlapping regions.
The Overset Volume Integral report uses this field function for a more accurate integration compared to the standard Volume Integral report for overset simulations. See Overset Volume Integral Report. When you use this field function, either through an Overset Volume Integral or for visualization in a scalar scene, the simulation runtime can increase significantly. To speed up the simulation time, do not evaluate the field function at every time step, but select and increase Frequency. You can similarly increase the time-step frequency for a scene by selecting . 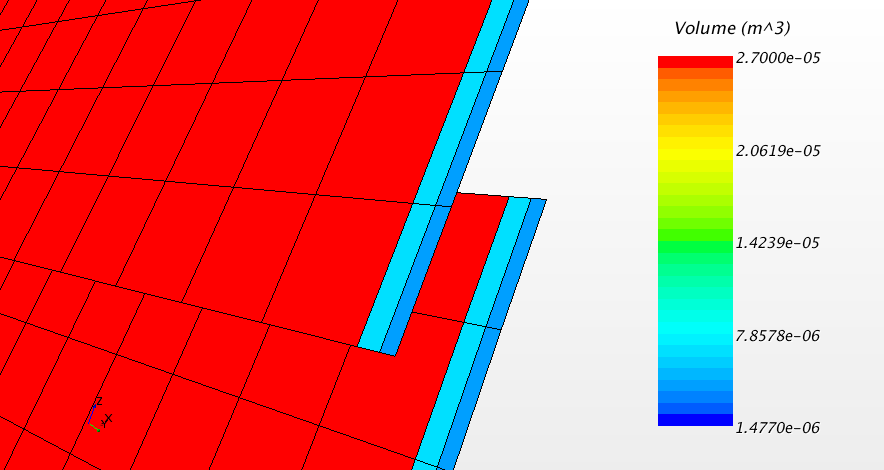 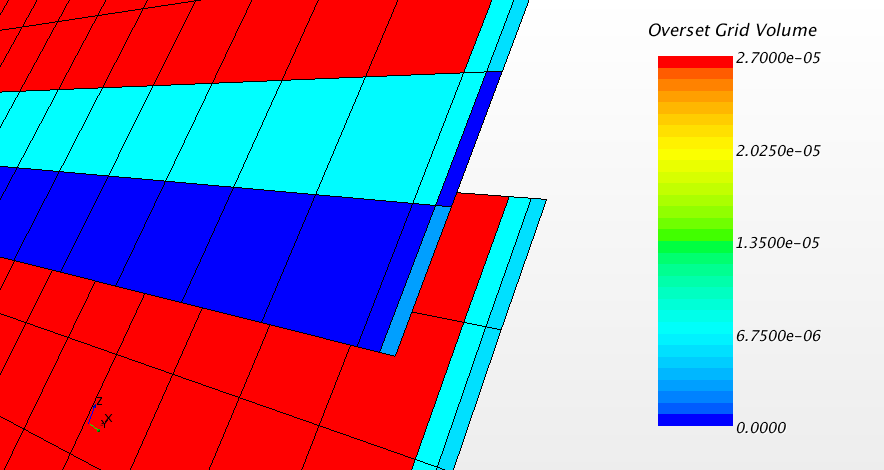 |
| Overset Interpolation Cell Size Ratio | Reports the ratio of cell
lengths between the background region and the overset region(s).
After an overset intersection, a cell size ratio is computed for
each acceptor cell defined by See also Donor Search and Overset Cell Type regarding the definitions of acceptor and donor cells. The possible
values of Dimension =
 The mesh sizes are
as following:
|
| Overset Interpolation Type | Indicates which
interpolation type Simcenter STAR-CCM+ is using for the interpolation between
background mesh and overset mesh. Although you specify the
interpolation type (see Option), Simcenter STAR-CCM+ can switch to a more robust
interpolation scheme in the course of the simulation when the
current mesh configuration makes it impossible to apply the selected
interpolation scheme. For example, when you select a
Linear or a LinearQuasi2D
interpolation scheme, Simcenter STAR-CCM+ can revert to the more robust
Distance
weighted scheme if the conditions for the
selected interpolation scheme cannot be met. At symmetry boundaries, in order to apply linear interpolation for the acceptor cells adjacent to the symmetry, the flow domain is imaginarily mirrored to obtain an additional ghost layer used as donor cells for the acceptor cells. This type of linear interpolation is labeled with value 7 - Ghost Cell Interpolation.  The possible values are:
|
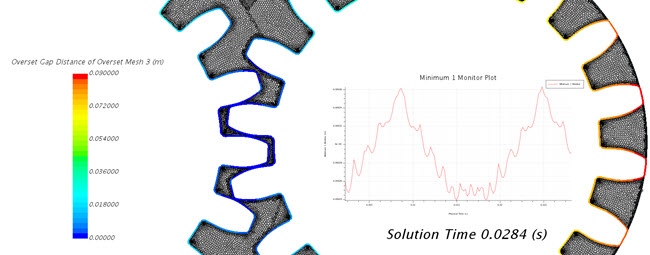
| Overset Gap Distance Field Function | Provides the gap distance
between wall-type boundaries of connected overset regions, or an
overset region with a background region for the purposes of
determining the cell-density required on the boundary surfaces to
resolve the flow in small gaps (using prism layers). The gap distance is calculated from the boundary to each cell face-centroid on the boundaries of the connected regions. It helps determining suitable user-inputs for the near-wall morphing / cell shrinkage feature. The Overset Gap Distance Field Function is only available when you create overset mesh interfaces. See Setting up Overset Regions. Boundary types considered as walls are: wall, contact, baffle, and porous-baffle. 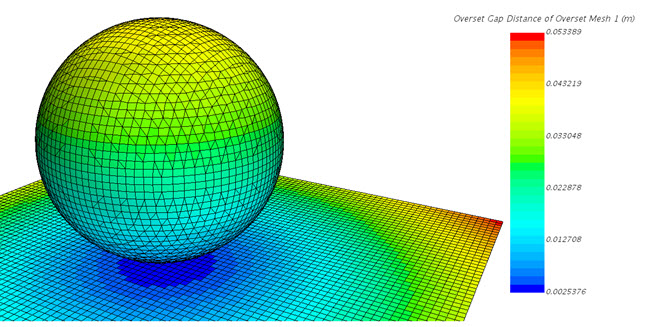 In some cases, it is prudent to report and monitor the minimum gap between two surfaces as they move together (or apart) over time—for example, a valve plug closing against its seat, or teeth on a gear-wheel engaging with its counterpart.
|
| Prism Layer Level | Outputs the prism layer indicator for a cell using the following numbers. Also works with imported volume meshes. The values of this function correspond to the marked layer number starting from 0, for vertices and cells, respectively. When plotting this field function, due to the two sets of values in vertices and cells, the final result depends on the Contour Style. All the non-prism cells are marked as -1. A diagram indicating the enumeration is shown below: 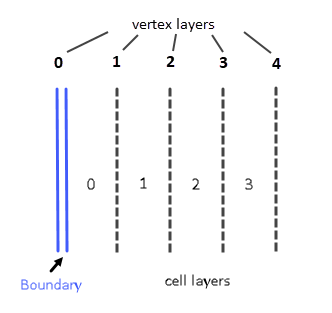 An example of this field function is shown below:  Prism Layer Level clearly detects the prism level jumps in the transition areas. |