Visualizing Results
The scene tabs display the results of the simulation.
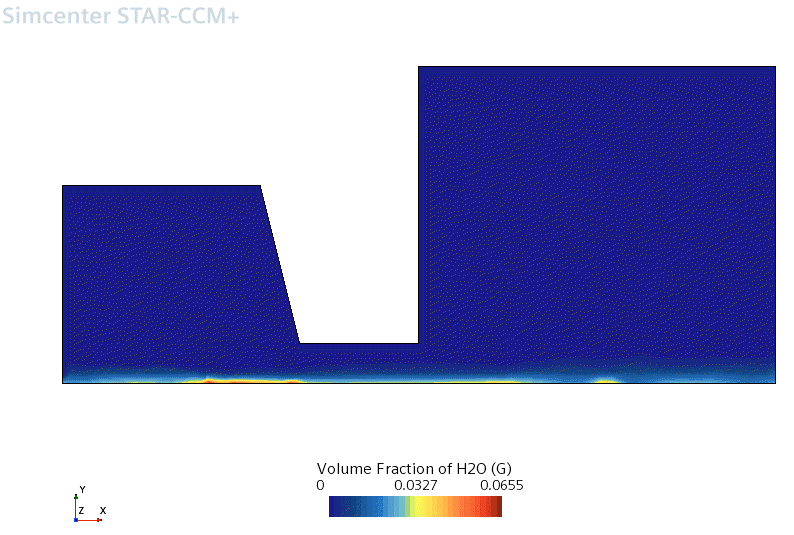
A vapor volume fraction scene similar to the one shown below is displayed.

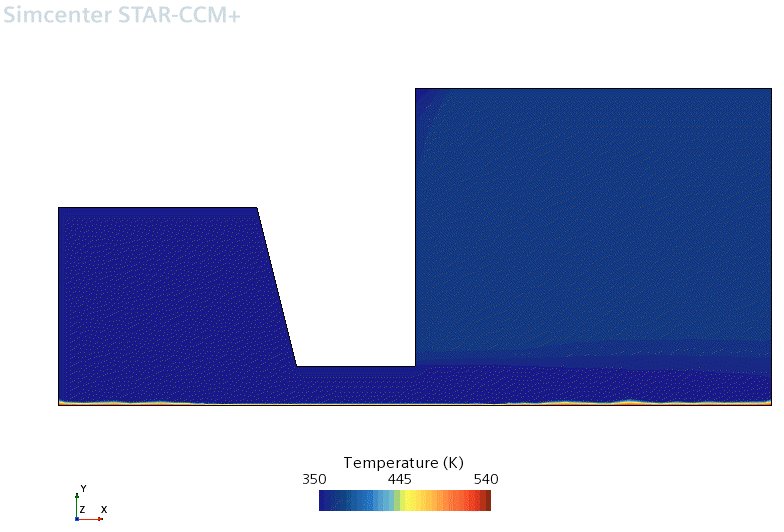
A fluid temperature scene similar to the one shown below is displayed.

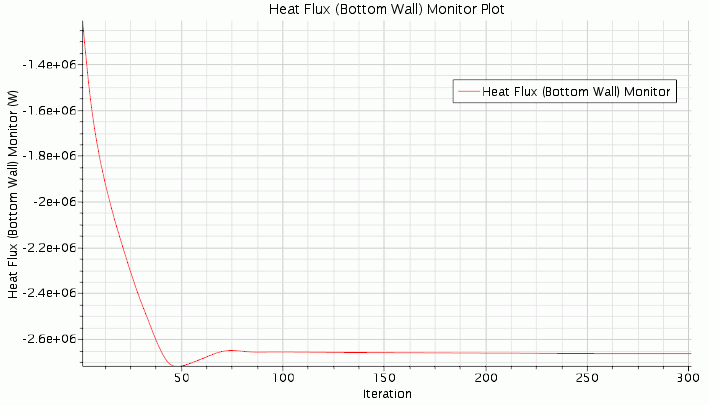
A heat flux profile similar to the one shown below is displayed.

From the above scenes, it is clear that the C_qw and n_p parameters have significant effects on the predicted levels of wall heat flux and the vapor volume fraction. In this example, you halved the heat flux on the bottom wall which resulted in the production of five times less water vapor. It is important therefore to make sure that correct values are used, to reflect the liquid-surface combination and the surface finish.