Visualizing the Solution
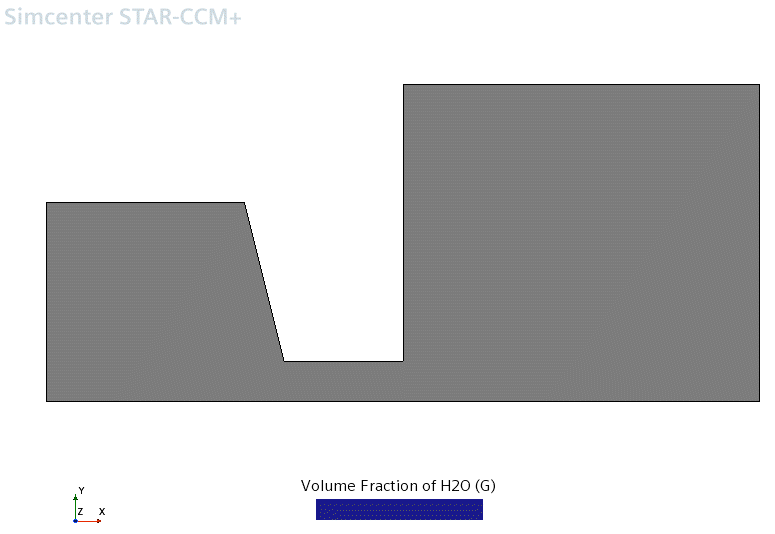
Create a scene to view the results of the simulation. You can view the distributions of the vapor volume fraction and fluid temperature throughout the run.
To view the results of the simulation:
-
Right-click the Scenes node and select .
The Scalar Scene 1 display appears in the Graphics window.
- Open the scene/plot window.
- Rename the Scalar Scene 1 node to Vapor Volume Fraction.
-
Select the node and set Function to .

- Select the Scalar 1 node and set Contour Style to Smooth Filled.
-
Use the mouse buttons to zoom in and position the part to obtain a view similar
to the view shown below.

- Follow the above steps and create another scalar scene.
- Rename the scene to Fluid Temperature.
- Set Function to Temperature.
-
Right-click the and select Open.

- Save the simulation.