Reporting, Monitoring, and Plotting
You create a heat flux report, monitor, and plot for the bottom wall to assess convergence to a steady-state solution.
To create the report, monitor, and plot:
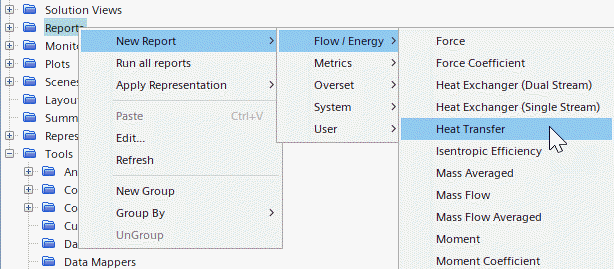
-
Right-click the node and select .

A new report is created named Heat Transfer 1.
To monitor heat flux on the bottom wall:
- Rename the Heat Transfer 1 node to Heat Flux (Bottom Wall).
-
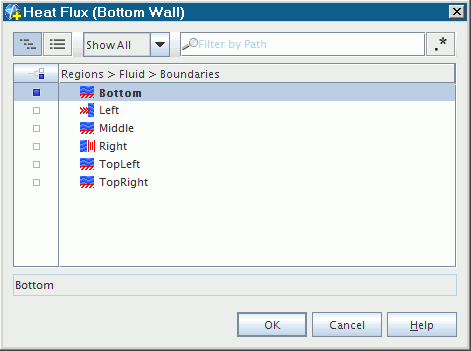
Make sure that the
node is selected and, in the
Parts property, click
 (Custom Editor).
-
Select
and click
.

-
Right-click the
Heat Flux (Bottom Wall) node and select
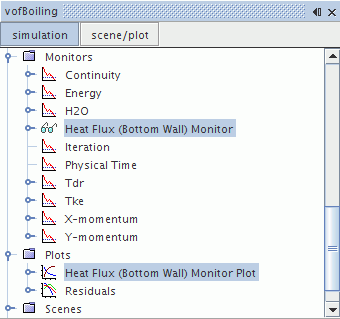
Create Monitor and Plot from Report.
A new monitor and plot is created.

- Select and set x-Axis Monitor to Iteration.