Maximum Pressure Time Plot
You create a plot of maximum pressure versus time.
- Right-click the node and select .
- Open the node and set Minimum to 0.0 and Maximum to 0.0533.
- Select the and set Label Spacing to 0.005.
- Select the node and set Title to Time (s).
- Select the node and set Title to Maximum Pressure (Pa).
The Graphics window contains a scene
similar to the following one.
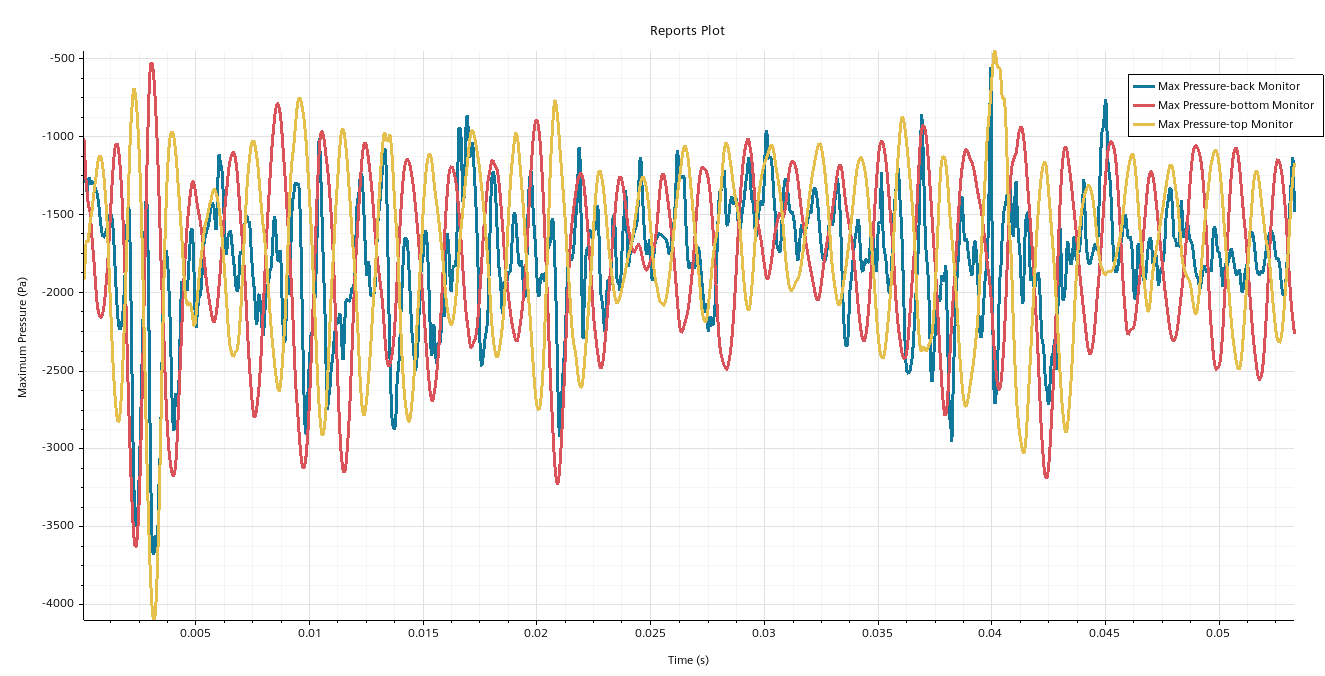
The mean pressure level remains constant while the top and bottom pressure probes identify anti-symmetric fluctuations.