Force Coefficients Time Plot
You moodify the axis range of the force coefficients plot.
- Right-click the node and select .
- Select the node and set Minimum to 0.0 and Maximum to 0.0533.
- Select the node and set Spacing to 0.005.
- Select the node and set Title to Time (s).
- Select the Left Axis node and set Minimum to -2.0 and Maximum to 2.0.
- Select the node and set Title to Force Coefficient.
A scene similar to the one shown
below is displayed.
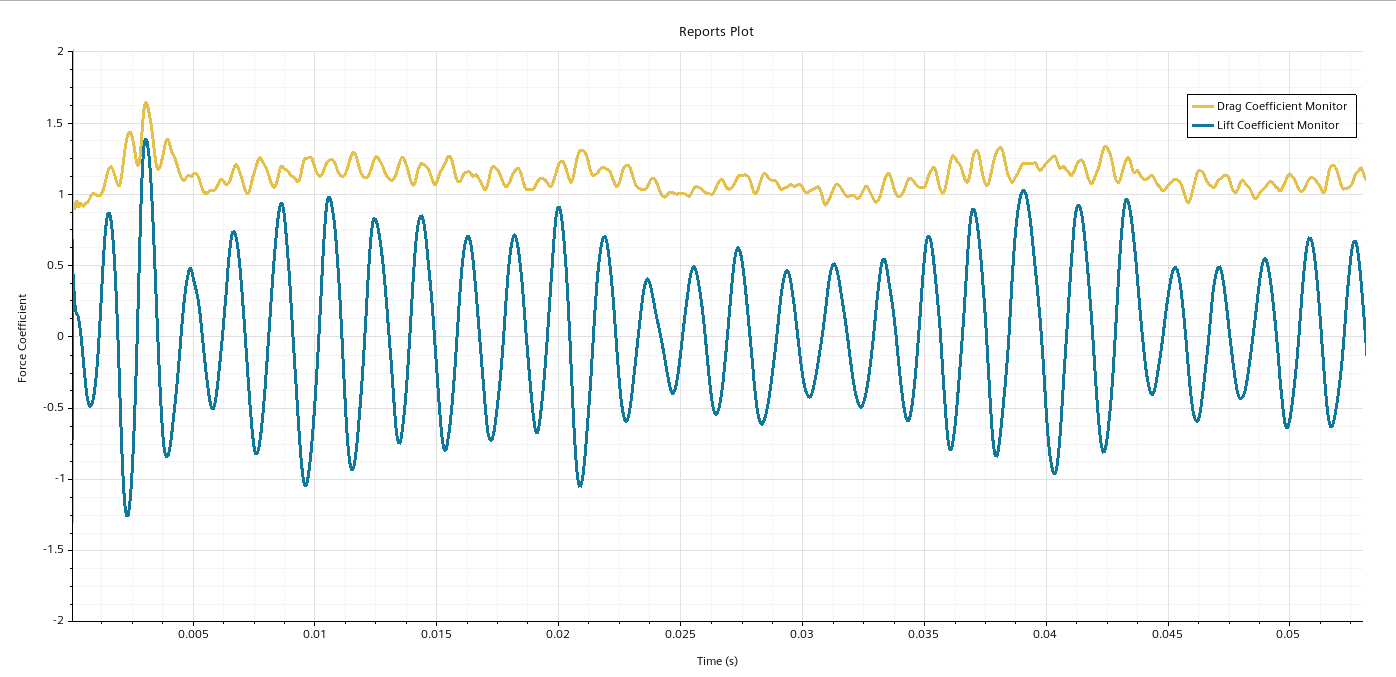
As expected, the mean lift is around zero and the mean drag is around 1 [452].