Visualizing the Results
After the solution finishes, you can view the results of the simulation.
-
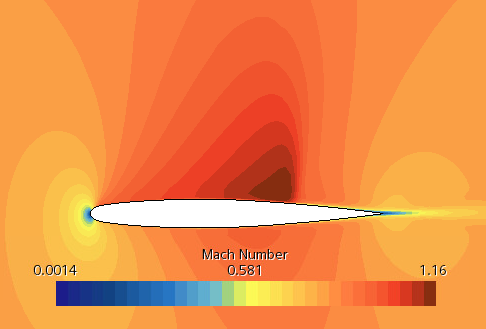
To display the Mach number profile, right-click the node and select Open.
The Mach number scene shows the transonic flow around the wing.
-
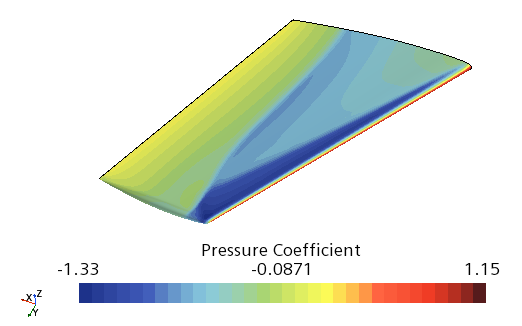
To display the pressure coefficient, right-click the node and select Open.
The pressure coefficient scene shows the lambda formation on the upper surface of the wing.