Validating the Results
Compare the numerical results against experimental data.
Right-click the node and select Open.
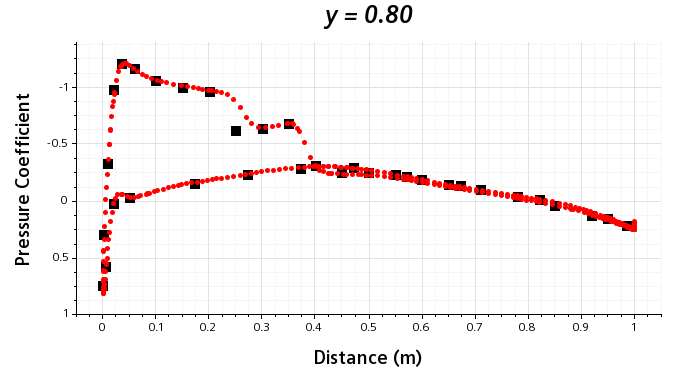
The plot appears as shown below.
Despite having a coarse mesh,
the numerical pressure coefficient compares well with the experimental data.
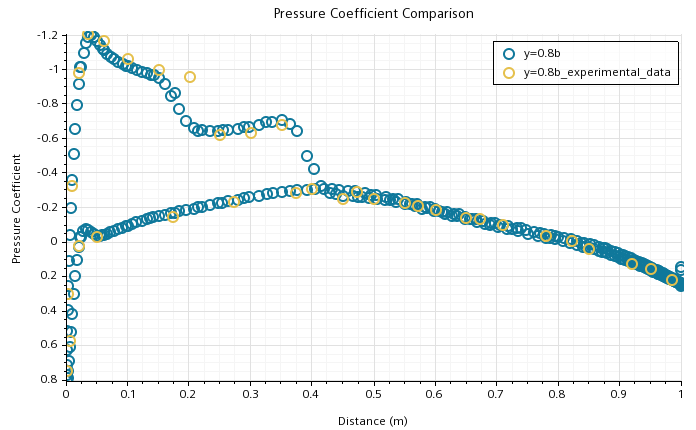
The plot shows that there are small discrepancies from experimental data. If
you want the solution to be more accurate, you can extend the domain to 10m
and refine the mesh in the boundary layer region. The plot below shows a
graph from a simulation case that had 11 million cells.