Visualizing the Results
After the solution finishes, you can examine results in plots and scenes.
-
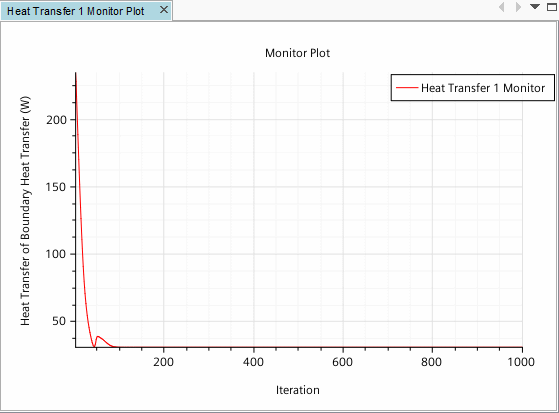
To view the heat transfer variation at the solid-fluid interface, activate the
Heat Transfer 1 Monitor Plot display.
-
To see the temperature and velocity vector results, click the tab for the
Scalar Scene 1 display.
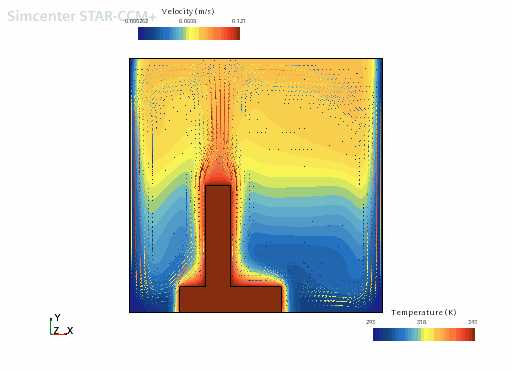
By default, filled cell values are shown. To make the display smoother:
-
Select the node and set Contour Style to Smooth
Filled.
The contours of the scalar display now appear smooth as seen in the following zoomed-in screenshot.
Filled: 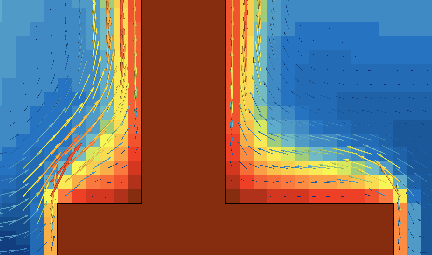
Smooth Filled: 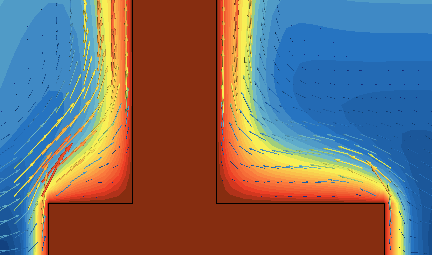
Additionally, the temperature solution of each region can be viewed by selecting the appropriate part.
-
Select the node and deselect the Fluid region.
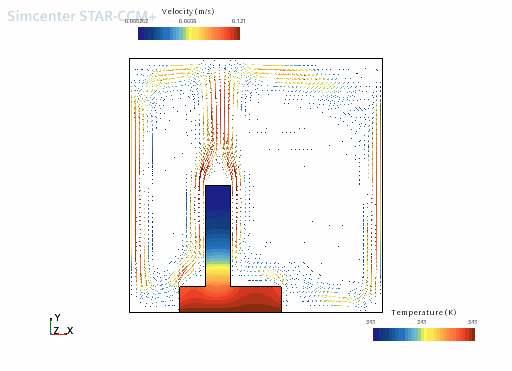
The display appears as shown below.
