Visualizing the Results
Examine the results of the simulation.
The scalar scene depicting the volume fraction of the vapor is shown below.
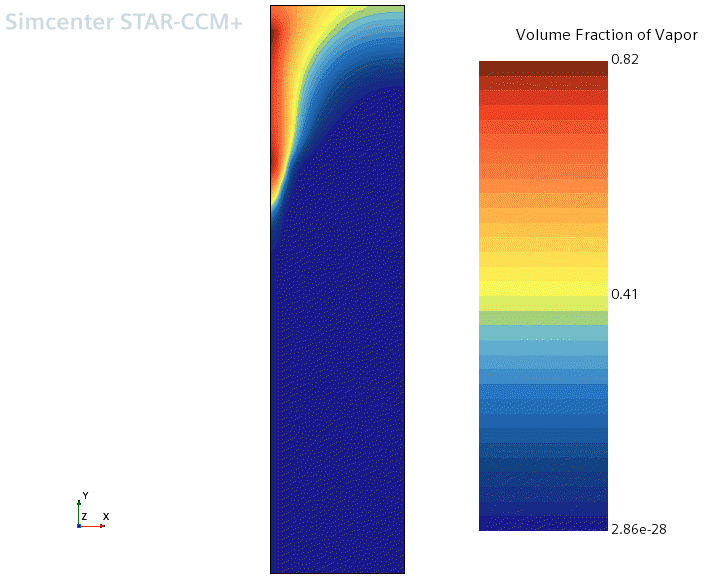
The first thing to look at is the vapor volume fraction distribution and to compare it with the liquid subcooling. This comparison can be done by switching the Scalar Field that is selected for the Scalar Scene.
The scalar scene depicting the liquid subcooling is shown below.
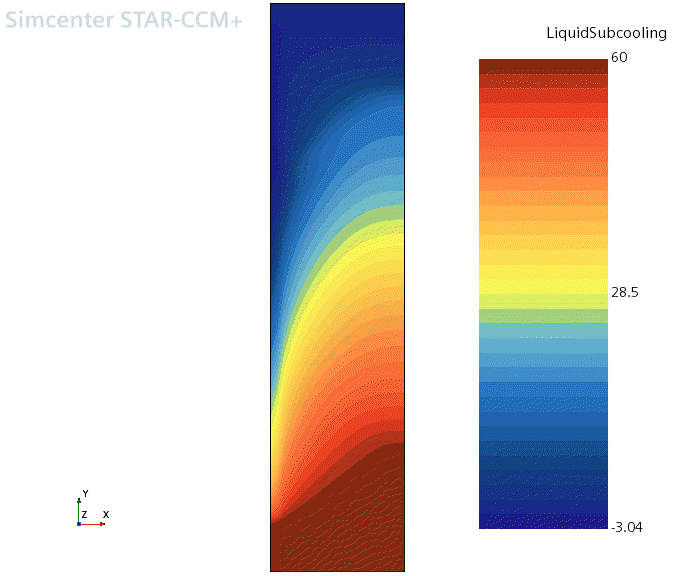
A small negative subcooling appears next to the wall, which in effect means that the liquid is superheated by a few degrees. The reason that it has not yet evaporated, is that the rate of evaporation is limited by the rate of heat transfer between the liquid and the liquid-vapor interface. Most of the vapor is confined to the region where the subcooling is not too high, below around 10 K. Elsewhere the vapor is quickly condensed as soon as it is produced on the wall. The vapor appears to spread quickly across the flow in this scaled scene, but in fact it is spread by the turbulent velocity fluctuations, modeled using the turbulent dispersion force.