Turbulence Checks
Examine the results to check the turbulence profile.
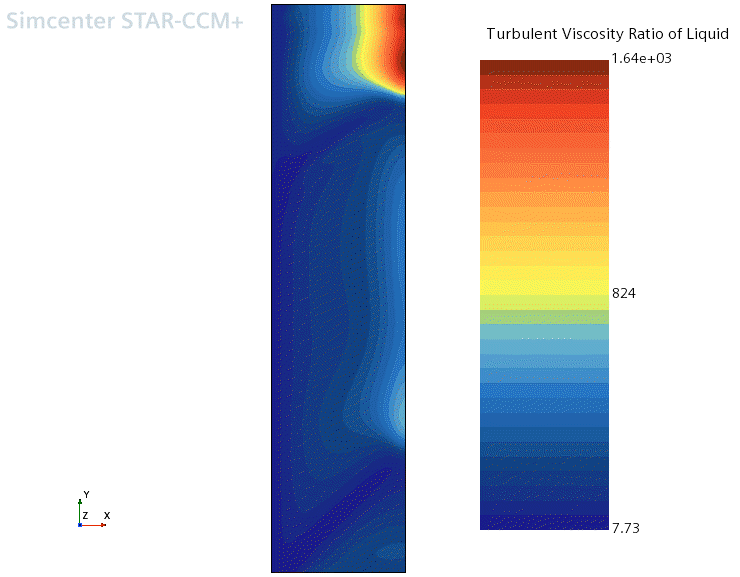
If you use the Scalar Scene to examine the Turbulent Viscosity Ratio of Liquid, you see that there are two troughs in turbulence across the flow.
The Scalar Scene is shown below:

The first occurs at the inlet and is entirely due to the use of flat velocity and turbulence profiles at the inlet. The second is due to the acceleration of the flow due to the onset of vapor production. The point here is to check that the first artificial feature is not interfering with the prediction of onset of boiling nor with the onset of vapor production. This scenario is the case here since the artificial first feature is well downstream of the inception of wall boiling. Under different conditions, the right thing to do would be to replace the flat inlet profiles by fully developed profiles of velocity, turbulence, and perhaps temperature.
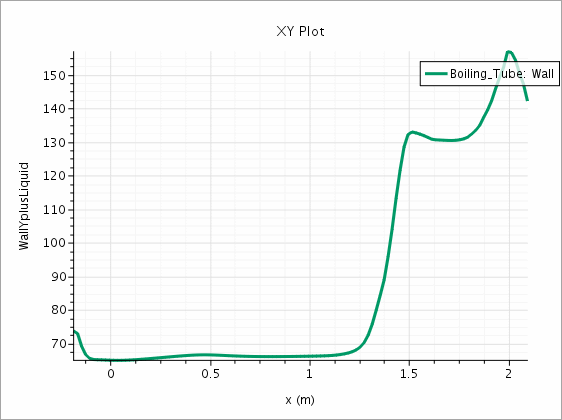
The second thing to check is that the predicted value of y+ at the first cell center next to the wall is well above 30.
The Wall Yplus of Liquid plot is shown below:

The computed y+ value confirms that a high-y+ wall treatment could have been used for this calculation. The two-layer treatment is retained so that this same model can be used under a wider range of conditions. The wall plot shows that y+ starts around 65 in the single phase region and then increases as the flow accelerates with increasing vapor content.