Visualizing the Solution
Create a scalar scene to display the results of the simulation.
A scalar scene is created to display the volume fraction of vapor. This variable can be monitored while the solver is running.
To visualize the solution:
- Create a scalar scene.
The view of the pipe in the scene is scaled using a simple transform so that the entire length of the pipe can be viewed in a smaller area. The transform also rotates the geometry so that it sits vertically.
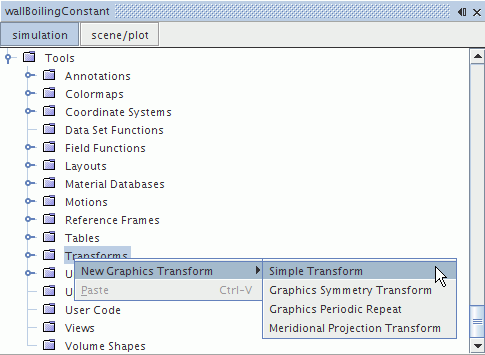
-
Right-click the node and select .

A new node, Simple Transform 1, is added to the Transforms node.
- Rename the Simple Transform 1 node to Scene Transform.
-
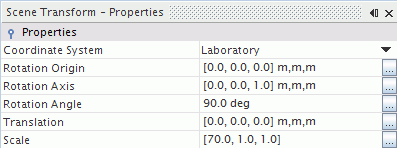
Select the Scene Transform node and do the following:
- Set the Scale to [70.0, 1.0, 1.0].
- Set the Rotation Angle to 90 deg.
The completed Properties window is shown below.

- Click scene/plot.
-
Select the node and do the following:
- Set the Contour Style to Smooth Filled.
- Set the Transform to Scene Transform.
Set the field function for the scalar scene:
- Select the node and set the Function to .
The color bar is edited so that it is positioned beside the vertical pipe.
-
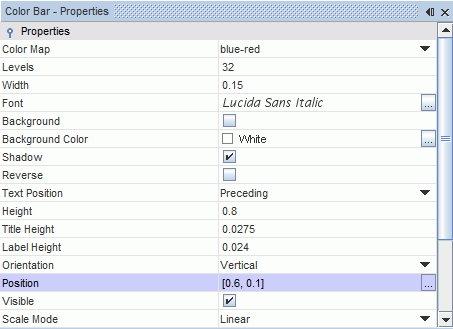
Select the node and do the following:
- Set the Orientation to Vertical.
- Set the Height to 0.8.
- Set the Width to 0.15.
- Set the Position to [0.6, 0.1].
The completed Properties window is shown below.

The Scene Transform is also applied to the Outline 1 node.
-
Select the node and set the Transform to
Scene Transform.
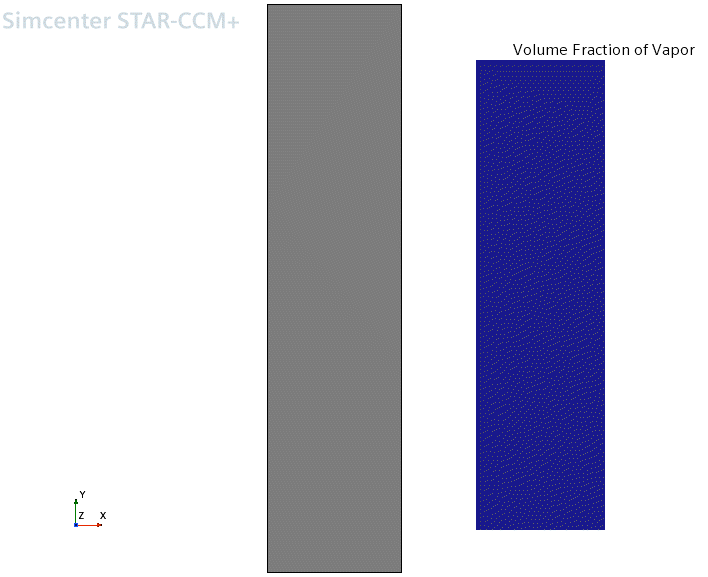
The scalar scene appears as shown below.

- Click simulation to return to the Simcenter STAR-CCM+ simulation object tree.
- Save the simulation.