Mesh Quality
Simcenter STAR-CCM+ provides a number of cell metrics that you can use to determine the overall quality of the volume mesh. In general, a poor quality volume mesh does not necessarily result in solver run time problems, but it does reduce the accuracy and efficiency of the solution obtained.
When assessing the overall quality of the mesh, consider the following factors:
- Mesh Density - Is the mesh sufficiently dense in high-gradient areas to capture flow features accurately?
- Mesh Distribution - Is the distribution of the mesh between high- and low-gradient areas optimal?
- Near Wall Layers - Does the mesh contain near-wall layers for calculating turbulence and heat transfer effects?
On a local (cell to cell) level, consider the following factors:
- Aspect Ratio - Is the aspect ratio reasonable for the expected flow regime?
- y+ Range - Are the y+ values reasonable for the turbulence model selected?
- Volume Ratio - Is the ratio of a cell volume to its neighbor reasonable?
- Skewness Angle - Are the cell skewness angles extreme?
For fluid flow calculations, grid quality has most impact on the calculation of the convective and diffusive fluxes:
- To obtain convective fluxes with optimum accuracy and robustness, the line connecting the centroids of neighboring cells must ideally pass as closely as possible to the centroid of the face separating the cells. A two-dimensional example of this problem is shown below:
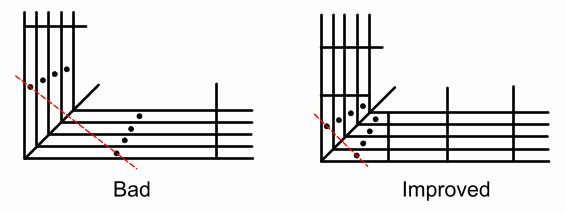
In this example, refining the mesh to create lower aspect ratio cells near the corner would improve the quality of the mesh.
- To obtain diffusive fluxes with optimum accuracy and robustness, the line connecting the centroids of neighboring cells must ideally be as close to orthogonal as possible to the face separating the cells. This angle is the cell skewness angle in
Simcenter STAR-CCM+. A two-dimensional example with high skewness angles is shown below:

In this example, refining the mesh to create lower aspect ratio cells would improve the quality of the mesh.
Mesh Metrics
There are many measures of cell quality, some of which are best suited to specific cell shapes. The metrics currently available in Simcenter STAR-CCM+ are:
- Face Validity
- Cell Quality
- Volume Change
- Cell Skewness Angle
- Chevron Quality Indicator
- Least Squares Quality
- Cell Warpage Quality
In order to create and visualize the face validity and volume change metrics, first initialize the solution with the appropriate physical models activated. For the above instances, you need only have the Three Dimensional space model selected before doing the initialization.
Each of the above metrics can be identified and visualized using a threshold as part of the geometry or scalar scene. See Identifying And Visualizing Bad Cells.
- Face Validity
-
The face validity is an area-weighted measure of the correctness of the face normals relative to their attached cell centroid.
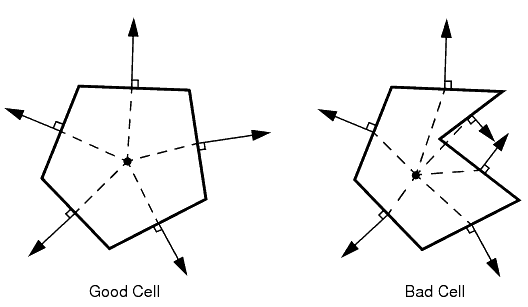
In a good quality cell, the face normals point outwards, away from the cell centroid. In a cell with bad face validity, one or more of the face normals point inwards, towards the cell centroid. A face validity of 1.0 means that all face normals are correctly pointing away from the cell centroid. Values below 1.0 mean that some of the cell faces have normals pointing inward towards the cell centroid, indicating some form of concavity. Values of below 0.5 signify a negative volume cell. Cells with a face validity below 1.0 are considered bad.
A minimum required value for the face validity metric can be entered on the dialog for removing invalid cells.
- Cell Quality
-
The cell quality metric algorithm is based on a hybrid of the Gauss and least-squares methods for cell gradient calculation methods. It is a function not only of the relative geometric distribution of the cell centroids of the face neighbor cells, but also of the orientation of the cell faces. Generally, flat cells with highly non-orthogonal faces have a low cell quality.
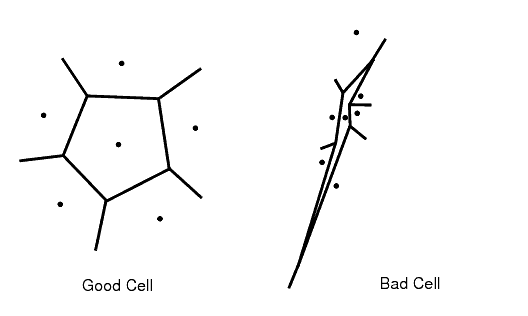
A cell with a quality of 1.0 is considered perfect. A cubic cell is an example of such a perfect cell, but other polyhedral cell shapes can also have a cell quality approaching unity. A degenerate cell has a cell quality approaching zero. Cells with a face quality less than 1.0e-5 are considered bad.
Depending on the physics that has been selected for the analysis, the cell quality of a cell can be fairly low and still provide a valid solution. However, poor cell quality is likely to affect both the robustness and accuracy of the solution. Cell quality is only defined for three-dimensional meshes.
A minimum required value for the cell quality metric can be entered on the dialog for removing invalid cells.
- Volume Change
-
The volume change metric describes the ratio of the volume of a cell to that of its largest neighbor.

A value of 1.0 indicates that the cell has a volume equal to or higher than its neighbors. As the cell volume decreases relative to its neighbors (such as a sliver or flat cell), then the volume change metric can be used to flag this cell. A large jump in volume from one cell to another can cause potential inaccuracies and instability in the solvers. Cells with a volume change of 0.01 or lower are considered bad cells.
A minimum required value for the volume change metric can be entered on the dialog for removing invalid cells.
- Cell Skewness Angle
-
This skewness measure is designed to reflect whether the cells on either side of a face are formed in such a way as to permit diffusion of quantities without these quantities becoming unbounded.
To understand this measure, consider the following two-dimensional diagram of a face and the cell centroids on either side of the face: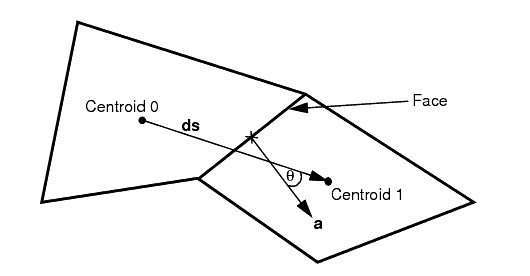
The skewness angle is the angle between the face area vector (face normal) and the vector connecting the two cell centroids, . An angle of zero indicates a perfectly orthogonal mesh. Variables that are stored at interior faces in Simcenter STAR-CCM+ cannot be displayed; instead, the worst skewness angle for all the faces of a cell are stored in that cell. Thus, two cells often have the same skewness angle corresponding to the face that they share.
Cells with a skewness angle greater than are considered bad cells.
Skewness angles of or greater (which can occur in concave cells where the centroid of both cells lies on the same side of the boundary face), typically result in solver convergence issues. Problems result because the diffusion term for transported scalar variables contains the dot product in the denominator, and this dot product is zero when the angle between and is . Even though Simcenter STAR-CCM+ takes care to avoid such a divide-by-zero error, the accuracy of the diffusion calculation is reduced, leading to a loss of robustness in such cases.
- Chevron Quality Indicator
-
Chevron cells are pairs of thin slender cells which meet at a common face at an angle such that the line joining the cell centers does not pass through the common face.
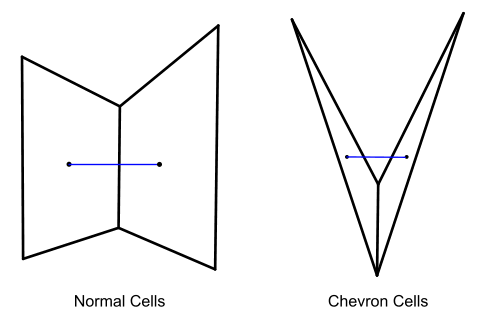
A chevron quality norm, , is used to determine whether a cell can be classified as a chevron cell or not:
where:- is a vector that is projected from the face center to the line joining the cell centers.
- is the vector from the face vertex to the face center.
-
The max function, in evaluating the chevron quality norm, is taken over all the face vertices.
The chevron quality norm is computed using a vector :
where:- is the face area vector.
- is the vector from the face center to the cell center.
- is the vector connecting the two cell centers.
Chevron cells are marked as 1.0 and every other cell as 0. Chevron cells are considered bad cells.
- Least Squares Quality
-
This field function is an indicator of the quality of a cell, using the physical location of a cell centroid relative to the cell centroid locations of its face-neighbors.

The field function value is based on the ratio of the maximum and minimum eigenvalue ratios of the symmetrical matrix:
where:- represents the vector from the cell to the neighbor centroid.
The field function then evaluates the eigenvalue ratio using a Jacobi transformation. A perfect cell has a Least Squares Quality of unity. An option also exists to include the boundary faces of the cell in the computation for boundary cells.
Cells with a least squares quality less than 1.0e-3 are considered bad.
- Cell Warpage Quality
-
Cell warpage quality identifies thin and warped cells. These types of cells can cause issues for the flow solver, especially for high fidelity simulations such as LES/DES and acoustics, where minimal dissipation is required.
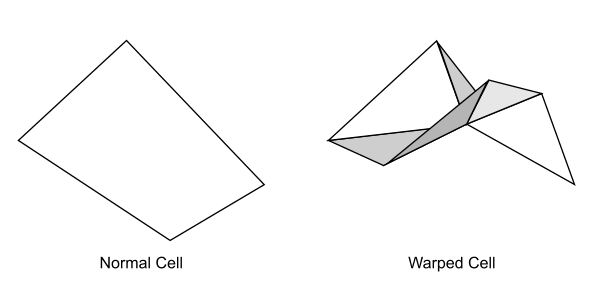
The warpage quality is based on the measured cell warpage angle of the face. The cell warpage angle is defined by:
where:-
d is the reciprocal distance projected on the face normal, which is defined by . The maximum is taken over the successive nodes of the face, and is the normal unit vector of the face.
-
L is the characteristic length scale of the face, which is defined by . Area is the area magnitude of the face.
The cell warpage angle is non-linearly scaled and transformed into the cell warpage quality. The cell warpage quality ranges from 0.0, which corresponds to the worst warpage, to 1.0, which corresponds to no warpage.
Cells with a cell warpage quality lower than 0.15, which corresponds to a cell warpage angle of , are considered bad cells. In general, the smaller the cell warpage angle, the better the quality is.
Only cells that have an aspect ratio smaller than 0.2 can have a warpage quality of less than 1.0.
Cell warpage quality is not included in the Cell Quality Remediation or Bad Cell Detection models. You can manually add cell warpage quality to these criteria through a Java macro, where the minimum value is 0.15 and the maximum value is 1.0.
-