Setting Up Scenes to Visualize Results
Create scalar scenes to visualize the results as the simulation progresses.
To create scalar scenes to visualize the results:
- Right-click Scenes and select .
-
Rename
Scalar Scene 1 to
Solid Volume Fraction.
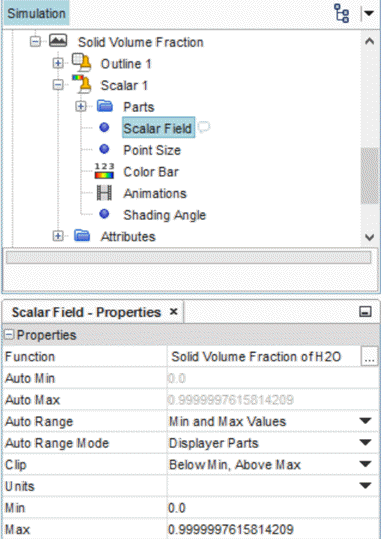
The solid volume fraction function represents the state of the H2O phase in each cell. When solid volume fraction is 1.0, ice is present in the cell, and when solid volume fraction is 0.0, (liquid) water is present. Do not confuse solid volume fraction with volume fraction which represents the phase in the cell. Volume fraction is always 1.0 in this case, since there is only one phase in this simulation: H2O.
-
Select and set Function to .

The domain is long in X and narrow in Y: this aspect ratio makes it hard to visualize any scalar field.

Apply a simple transform to scale the Y axis for a better solution representation.
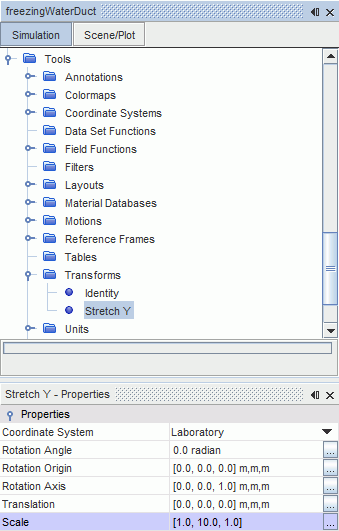
- Right-click and select .
- Rename the Simple Transform 1 node to Stretch Y.
-
Set
Scale to
[1.0, 10.0, 1.0].

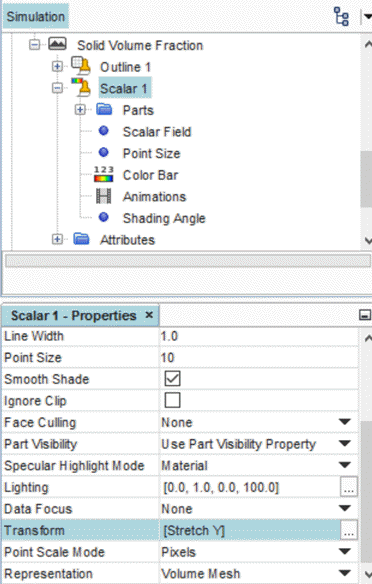
Apply the Stretch
Y transform to the Solid Volume Fraction
scene.
- Select and set Transform to Stretch Y.
-
Select and set Transform to Stretch
Y.

- With Scalar 1 still selected, set Contour Style to Smooth Filled.
Create more scenes to display pressure and velocity.
- Click and while holding the left mouse button, drag the Solid Volume Fraction node onto the Scenes node and rename the new node as Pressure.
- Select and set Function to Pressure.
- Save the simulation.