Visualizing the Results
View the results of the solution.
After the run is finished, look at the scalar and plot displays.

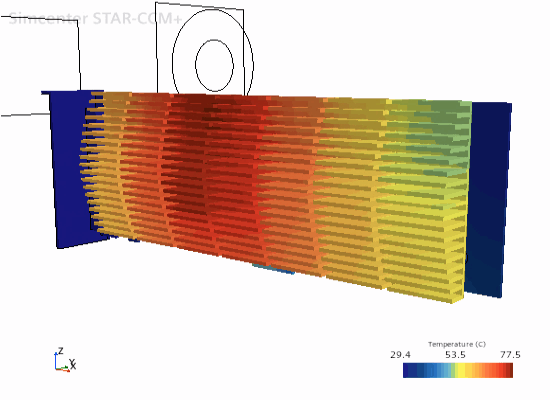
The temperature on the graphics card is shown in the following screenshot.

The thermal conductivity tensor is visualized in the following screenshot:

The temperature monitor plot is displayed in the following screenshot. From this plot, you can see that the solution has converged.

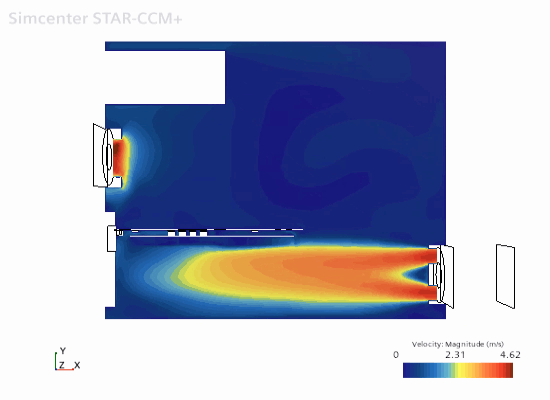
The following screenshot illustrates air flow inside the case.

The temperature on the graphics card is shown in the following screenshot.

The thermal conductivity tensor is visualized in the following screenshot:

The temperature monitor plot is displayed in the following screenshot. From this plot, you can see that the solution has converged.
