Visualizing the Results
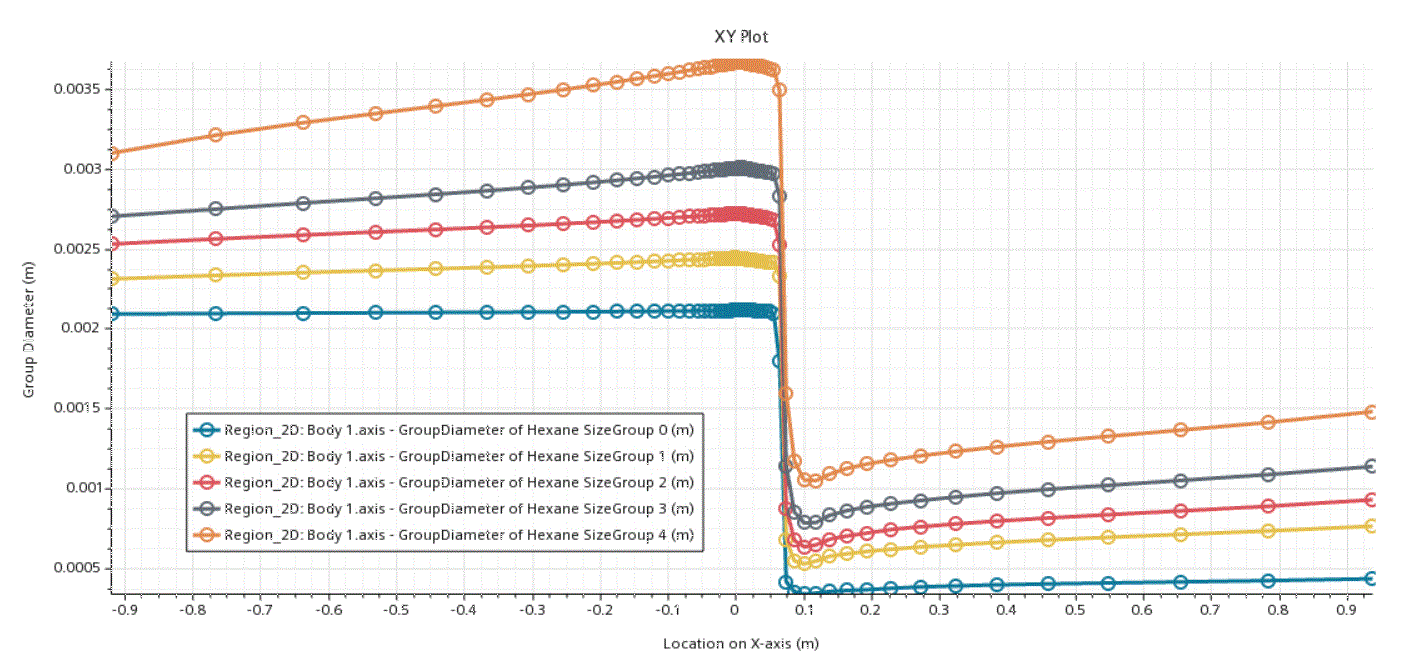
The resulting plots show the development of the size-group diameters as the hexane droplets progress along the pipe. The scenes show the regions where droplet breakup and coalescence are occurring, and the distribution of the droplet mean diameter values in the flow.
If necessary, adjust the scene to zoom in on the area that you want to view.
Group Diameters Plot
In this plot, some coalescence—especially for large diameters—is observed upstream of the restriction followed by significant breakup as the droplets pass through the region of intense turbulence downstream. Beyond the turbulent region, droplet coalescence resumes. The droplet size distribution can be inferred from the spacing of the five size-group diameters. The line that is plotted for each group represents the mean volume fraction of that group, so the five lines that are shown in the plot can also be read as 10%, 30%, 50%, 70%, and 90% cumulative volume fractions of hexane.
Mean Diameters Plot
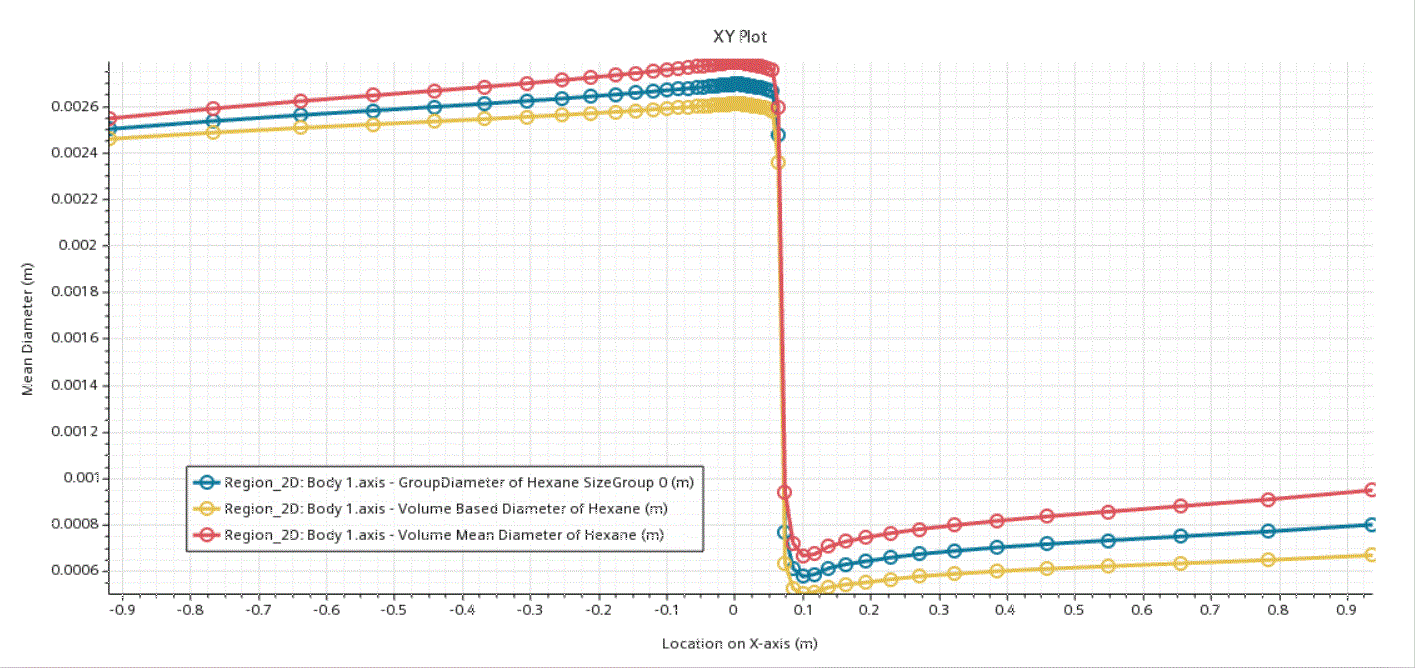
In the Mean Diameters plot, the differences between diameters indicate polydispersity of the size distribution.
Breakup Rate Scene
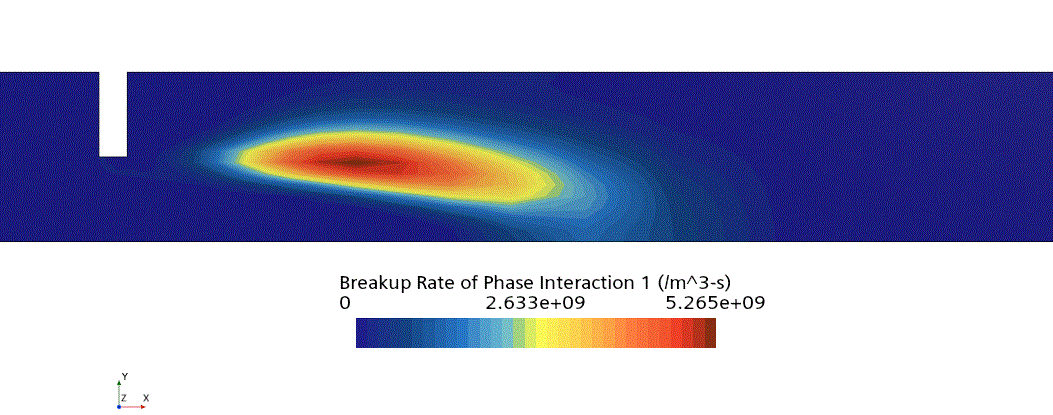
Here, you can see a high breakup rate in a localized region of turbulence downstream of the restriction, but practically zero breakup elsewhere.
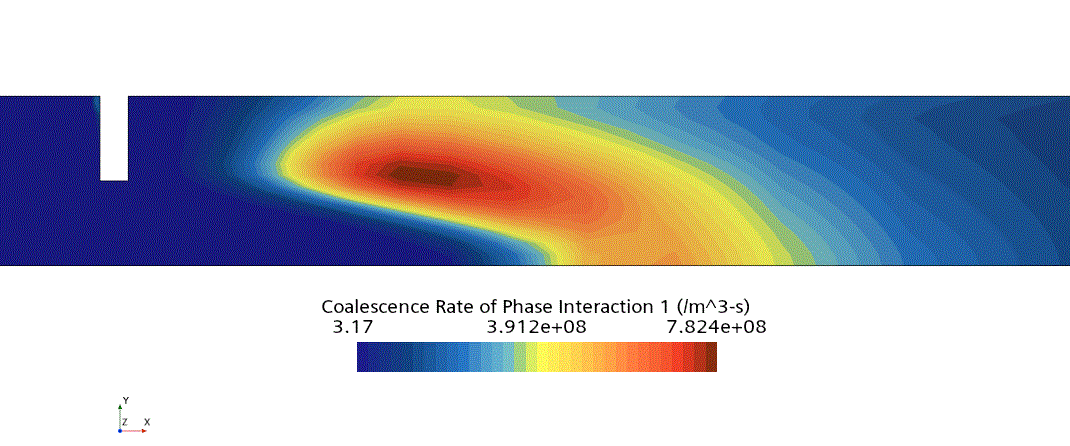
Coalescence Rate Scene
This scene shows a strong peak in the coalescence rate in the area downstream of the region of intense turbulence (where most of the droplet breakup occurs). This increase corresponds to the increased population of smaller droplets.
Sauter Mean Diameter Scene
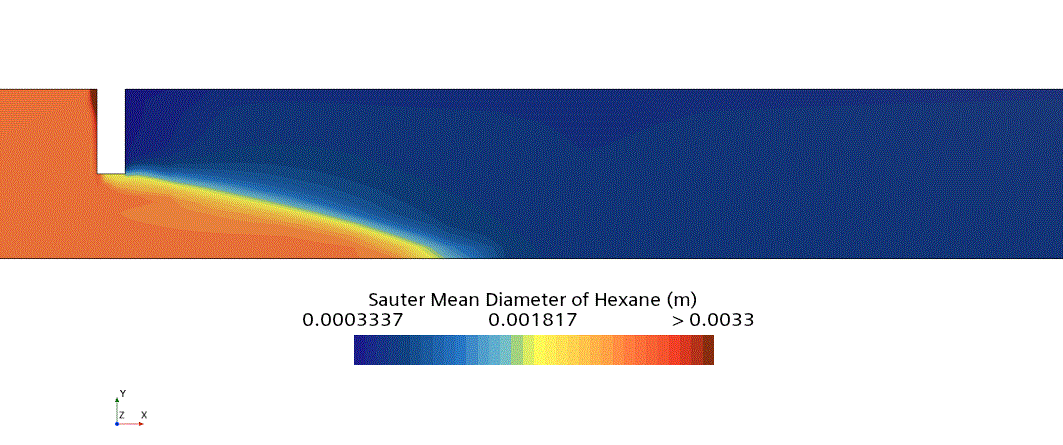
The Sauter Mean Diameter of the droplets reduces by half as they pass through the turbulent region of the flow.
