Visualizing the Adjoint Solution
Specific adjoint field functions are available to visualize the adjoint solution.
To visualize the adjoint solution:
- Create a scalar scene.
- Click the scene/plot button.
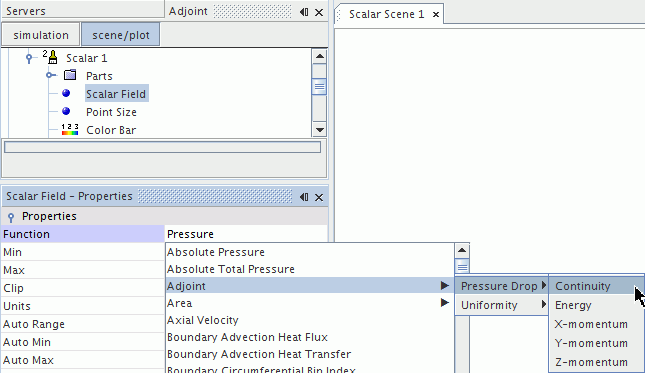
- In the scalar scene, select the node.
-
In the
Properties window, click on the field next to
Function. In the drop-down list, select
Adjoint. For each of the previously specified cost functions, you can select a menu item.

The adjoint <cost function> field functions are available with regard to continuity, energy, X-, Y- and Z-momentum.
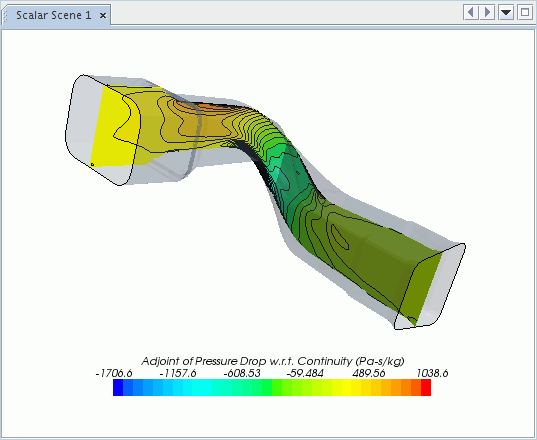
The adjoint solution is displayed in the currently open scalar scene in the Graphics window.
An example is shown below:

You can see the adjoint of the pressure drop with regard to continuity. This means that the plot shows you the sensitivity of the cost function, in this case the pressure drop, with regard to mass. (The continuity equation corresponds to the mass conservation equation.) According to Eqn. (5084), the flow adjoint represents the sensitivity of the cost function with regard to the flow residual. Consequently, the adjoint with regard to continuity residual indicates that directing mass away from areas with positive adjoint values decreases the cost function, in this case, the pressure drop. While directing mass towards areas with positive adjoint values, increases the cost function. Red areas in the plot indicate that directing mass away from these areas has the most effect on lessening the pressure drop. Blue areas in the adjoint plot also indicate a high sensitivity of the cost function with regard to mass. Directing mass away from areas with negative adjoint values increases the cost function. You can apply this interpretation of results to the other residuals, that is to the momentum and energy residuals, as well.