Scene Colors Reference
Scene displays include multi-colored bars to map values to colors for scalars, vectors or streamlines. You can control the appearance of the bar in the scene with the displayer’s color bar object.
Color Bar Node Properties
- Color Map
- Selects colors to indicate values from lowest to highest. This property lets you customize the use of colors in the scalar scene. For a list of the pre-defined choices, see Pre-Defined Color Maps.
- Levels
- Sets the number of levels into which the range of data should be divided. Higher numbers produce finer blends between values. The default setting is 32.
- The change is visible in the display for both the bar and the visible
parts.
32 levels (default number) 64 levels - Width
- Controls the width of the color bar. The number is a fraction of the display width; 1.0 equals the full width of the display.
- Font
- Sets the font of the color bar text.
- Background
- Activates or deactivates the color bar background.
- Background Color
- Controls the color of the background. The property customizer executes the define color action. See Defining Colors.
- Shadow
- Activates a shadow effect for the text of the color bar.
- Reverse
- Reverses the sequence of the selected colormap (for example, red to blue rather than blue to red).
- Text Position
- Sets the position of the text relative to the color bar:
- Preceding—the text appears before (above) the color bar.
- Succeeding—the text appears after (below) the color bar.
- Height
- Sets the height of the color bar and its label.
- Title Height
- Specifies a height for the title (field function label) of the color bar relative to the display height. The value is a fraction of the height of the display window, where 1.0 is the full height.
- Label Height
- Specifies a height for the numeric labels of the color bar relative to the display height. The value is a fraction of the height of the display window, where 1.0 is the full height.
- Orientation
- Defines orientation of the color bar, horizontal or vertical.
- Position
- Specifies the position in the display of the visualization display as X and Y coordinates from 0 to 1.
- Visible
- Shows or hides the color bar.
- Scale Mode
- Activates a logarithmic scale mode for the color bar.
- Text Color
- Controls the color of the text. The property customizer executes the define color action. See Defining Colors.
- Opacity
- Adjusts the transparency of the color bar. The settings range from 0.0 (invisible) to 1.0 (opaque). This property allows you to show the bar as an overlay in front of the model.
- Label Format
- Defines the numeric
formatting of the numbers that are displayed along the color bar. The
property customizer activates a dialog with interactive controls.
Alternatively, text elements that can be entered here are identical to those described in the section What Is the Number Format?
- Ramp Type
- Sets the shape of the table ramp to either linear, S-curve, or
square-root:
- Linear—specifies a linear ramp.
- S-curve—uses
the S-curve, which tails off gradually at each end:
- Sqrt—uses the square root, .
- Number of Labels
- Controls the number of value labels along the color bar.
Pre-Defined Color Maps
Simcenter STAR-CCM+ includes a set of pre-defined color maps for you to use in controlling the display of colors in scenes.
Color Map Categories
The pre-defined color maps can be aligned with at least one of the categories below:
- Perceptual
- Color maps in this category have well ordered colors and are nearly or fully colorblind accessible.
- Qualitative
- Use these color maps to create high impact visualizations. Some of these maps are based largely on saturated colors and are intended to deliver strong visual aesthetics.
- Divergent
- Use these color maps to highlight differences across a scalar range. Some maps are effective at highlighting small differences while other maps are designed to highlight large differences in range.
- Specialty
-
These color maps are recognizable and designed for specific uses. The land elevation (or land sea elevation) maps are based on geographical surface elevation contours, for example.
In addition to the color maps listed here, which are designed for scene displays, other pre-defined color maps are designed for bubble plots. For details, see the description of the Color Map property in Bubble Plot Objects Reference.
-
Color Maps
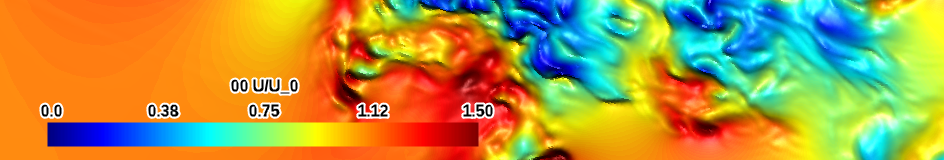
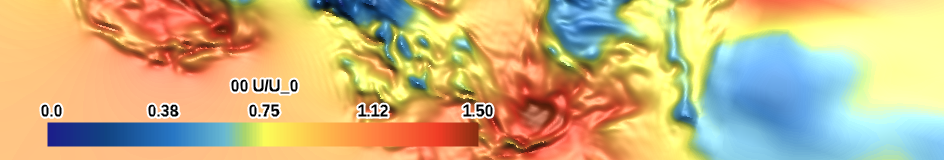
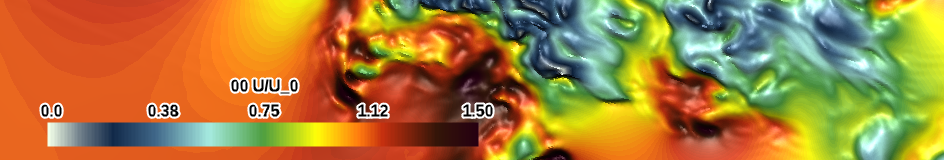
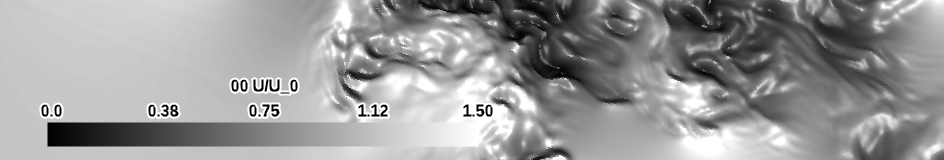
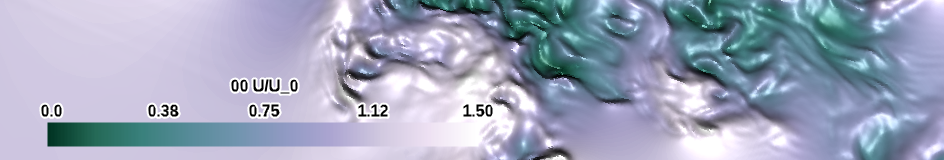
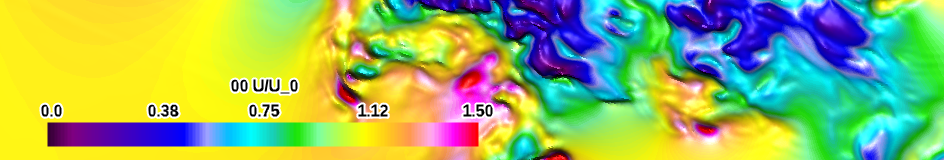
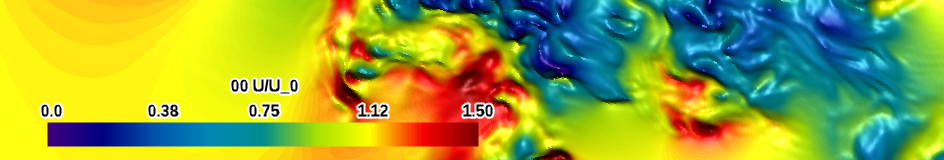
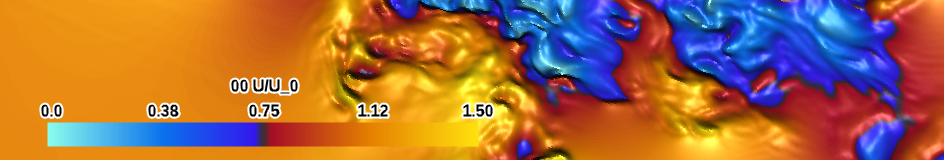
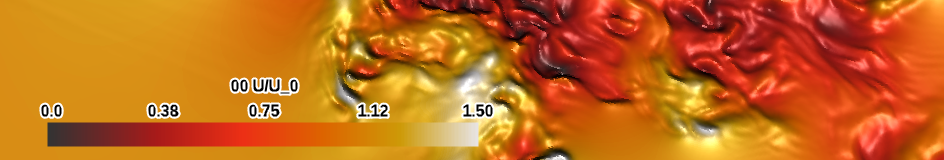
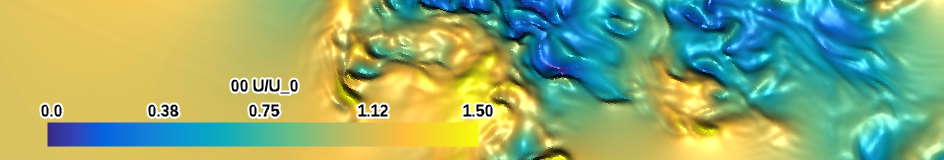
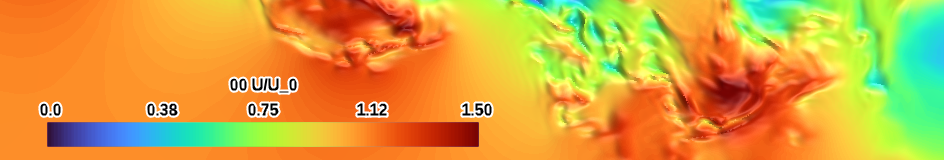
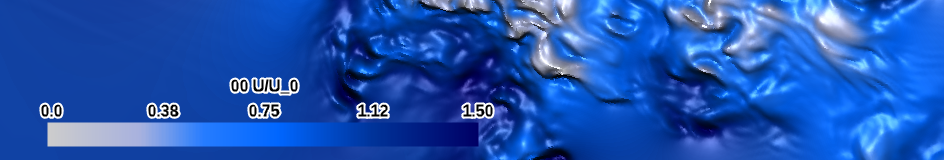
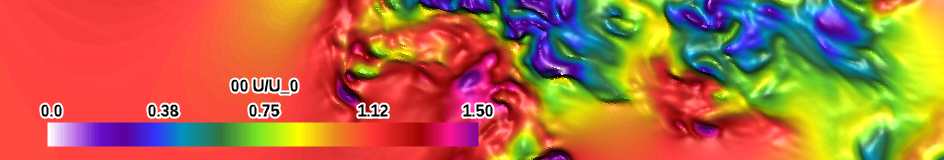
In the table below, each of the pre-defined color maps is applied to the same visualization scene.
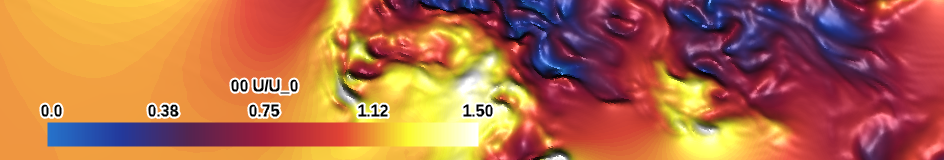
| blue-red (qualitative) |
 |
|
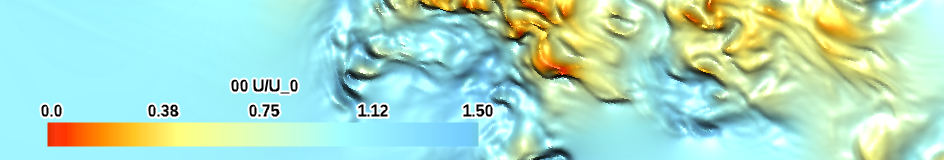
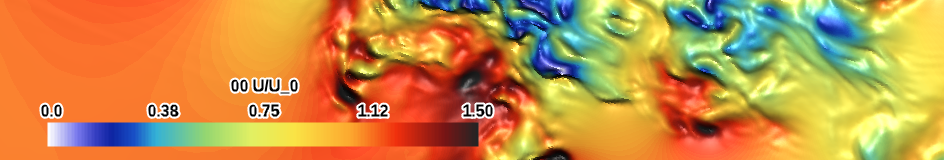
| blue-red balanced (qualitative) |
 |
|
| blue-red bright (qualitative) |
 |
|
| blue-red-band (qualitative) |
 |
|
| blue-red-highpass (qualitative) |
 |
|
| blue-red-lowpass (qualitative) |
 |
|
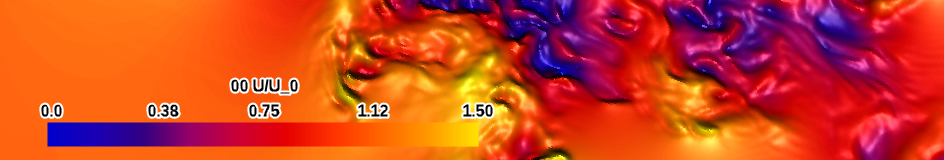
| blue-yellow-red |
 |
|
| casting (specialty map) |
 |
|
| cool-warm (qualitative) |
 |
|
| cool-warm-band (qualitative) |
 |
|
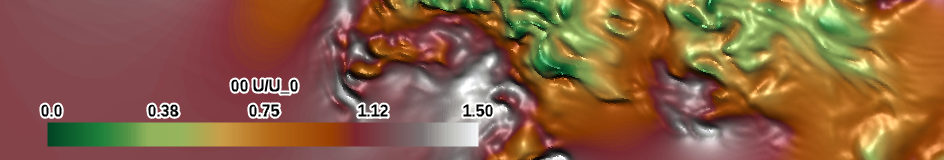
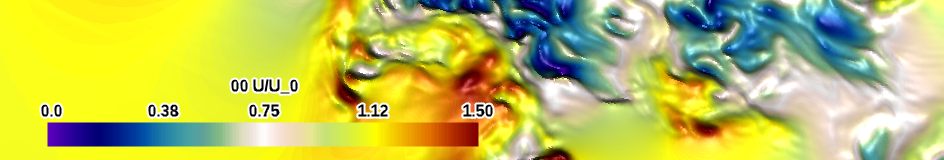
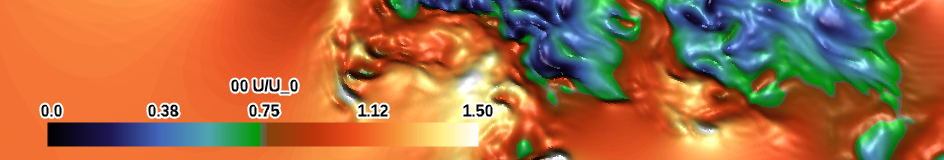
| gray-darkred (qualitative) |
 |
|
| grayscale (perceptual) |
 |
|
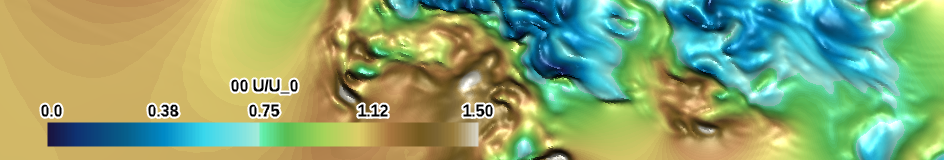
| green-mauve (perceptual) |
 |
|
| high-contrast (qualitative) |
 |
|
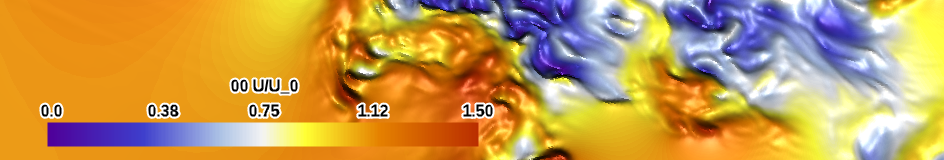
| indigo-white (qualitative) |
 |
|
| Kelvin temperature (specialty) |
 |
|
| land elevation (specialty) |
 |
|
| land sea elevation (specialty) |
 |
|
| orchid-green (perceptual) |
 |
|
| purple-red (qualitative) |
 |
|
| purple-red (large difference) (divergent) |
 |
|
| purple-red basic (large difference) (divergent) |
 |
|
| radiation spectrum (divergent) |
 |
|
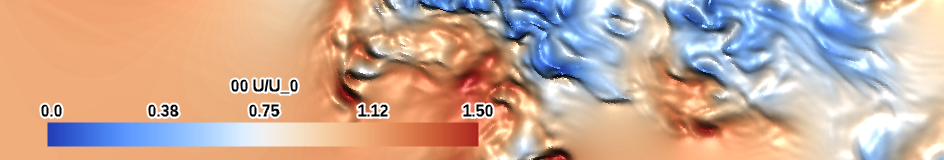
| red-blue (small difference) (divergent) |
 |
|
| red-green (small difference) (divergent) |
 |
|
| red-purple desaturated ends (qualitative) |
 |
|
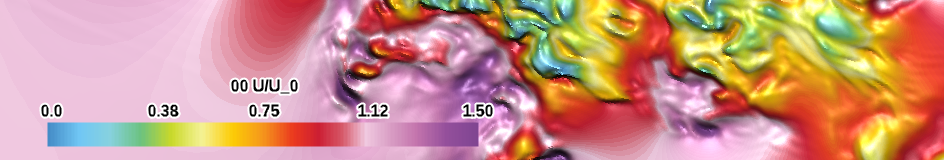
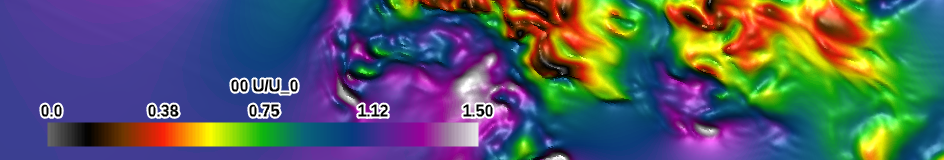
| spectrum (qualitative) |
 |
|
| thermal (specialty) |
 |
|
| tropical (perceptual) |
 |
|
| turbo (perceptual) |
 |
|
| water (perceptual) |
 |
|
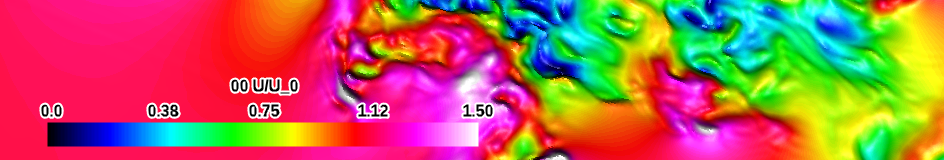
| white-pink (qualitative) |
 |
|
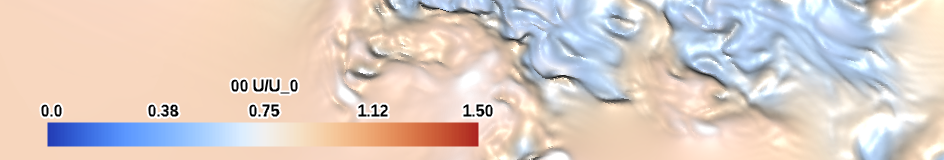
| white-red (qualitative) |
 |
|
Color Map Dialog Controls
The Edit Color Map dialog exposes several properties for the color spectrum and control points along it.
- Preview Mode
- Controls how the dialog previews your changes.
- On Change—shows the effect as soon as you complete a change.
- Manual—shows the effect after you complete a change and click Preview.
- Continuous—shows the effect as you are making a change.
- Color Space
- Sets the color space that is used for interpolation.
- RGB (Red, Green, and Blue)—the color model that is commonly used in video displays.
- HSV (Hue, Saturation, and Value)—works like mixtures of paint.
- Lab—the CIE-L*a*b system.
- Diverging—involves a special mode where colors pass through white when interpolating between two saturated colors.
- HSV-Wrapped—uses HSV, but takes the shortest path in Hue (going back through 0 if that is the shortest way around the hue circle).
Color Maps Node Actions
Use this pop-up menu to create color maps.
- New
- Adds a new color map to the Color Maps node.