Bubble Plot Objects Reference
The Bubble Style node and its sub-nodes let you control the appearance of a third and fourth variable in a plot display.
Specific nodes referenced here are:
Bubble Style
This node consists of properties and sub-nodes for controlling the shape in the plot. The sub-nodes control size, color, and data range.
| Shape |
Choose one of the following shapes for the symbols:
|
|
| Border Width | Sets the border width as a fraction of the overall symbol size. | |
| Opacity | Sets the transparency, with 0.0 being invisible and 1.0 being fully opaque. | |
| Border Color | Selects the border color from a
palette. Clicking  (Custom
Editor) gives you more choices for colors. See Defining Colors. (Custom
Editor) gives you more choices for colors. See Defining Colors. |
|
| Color Fill Mode |
Choose one of the following modes for coloring the shapes: |
|
| None | Leaves the shapes without any fill. Only borders and (where applicable) negative "X" symbols within the shapes are visible. | |
| Constant | Use the Bubble Fill Color sub-node to apply a color to the shapes. | |
| Variable | Use the Color Scaling Data sub-node to display an additional scalar function in the shapes using variations in color. A color bar appears in the plot display alongside the size legend. | |
Size Scaling Data
This node provides controls for size and data ranges.
| Minimum symbol size | The smallest size, in pixels, of the symbol. This property is read-only (that is, ignored) when you set Scale mode to Area (Square Root). The Area scaling mode only uses the maximum size setting because it scales everything downward from the maximum. | |||
| Maximum symbol size | The largest size, in pixels, of the symbol. | |||
|
Scale mode |
Width (Linear) |
The linear scaling uses the following scaling for symbol size , for a given input data value : |
||
| Logarithmic |
The logarithmic scaling uses the following scaling for symbol size , for a given input data value : |
|||
| Area (Square Root) |
The square root scaling uses the following scaling for symbol size , for a given input data value :
|
|||
| Show negative symbol sizes |
When activated, includes negative values among the symbols, scaling their size using the magnitude of the value. The symbols that represent those values contain an "X" to differentiate them from the positive values. Also, a ± sign is included in the legend. 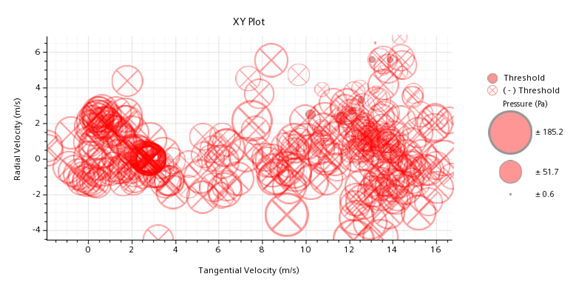 When Scale mode is set to Width (Linear), this option is not relevant and is therefore deactivated. |
|||
| Data range mode | Auto | Uses the full range of solution values for the selected scalar. | ||
| Manual | Uses the values in a range that you specify. | |||
| Auto data range min, Auto data range max | The minimum and maximum scalar values, respectively,
automatically calculated (read-only).
|
|||
| Manual data range min, Manual data range max | The value that you specify for the beginning and end of the data range, respectively. Editing either of these properties automatically switches the Data range mode from Auto to Manual. | |||
Color Scaling Data
This node controls the coloring of symbols according to the range of data values.
|
Color Map |
Selects colors to indicate values from lowest to highest. This property lets you customize the use of colors in the bubble plot. There are pre-defined color maps that are especially suitable for bubble plots. They have minimal use of light yellow, so that the symbols can be seen easily, even with transparency. However, depending on your data range, you should choose your color map carefully so that all the symbols in your plot are sufficiently visible.
For a list of the other pre-defined choices that are more suitable for scene displays, see Color Maps. |
|||
| Levels | Sets the number of levels into which to divide the range of data. Higher numbers produce finer blends between values. The default setting is 32. | |||
| Reverse | When activated, reverses the sequence of the selected color map (for example, red to blue rather than blue to red). | |||
| Scale Mode | When set to Linear or to Log10, uses a linear or logarithmic scale mode, respectively, for the color bar. The logarithmic scaling of color cannot be applied to values of mixed sign. | |||
| Ramp Type | Sets the shape of the table ramp to either linear,
S-curve, or square-root. If you use the Linear ramp, colors vary
linearly to bin values. The other ramp modes distort this color
mapping according to the corresponding functions:
|
|||
| Data range mode | Choose between Auto, which uses the full range of solution values for the selected scalar, or Manual, which allows you to set the range yourself. | |||
| Auto data range min, Auto data range max | The minimum and maximum scalar values, respectively,
automatically calculated (read-only).
|
|||
| Manual data range min, Manual data range max | The value that you specify for the beginning and end of the data range, respectively. Editing either of these properties automatically switches the Data range mode from Auto to Manual. | |||

Bubble Fill Color
With the Bubble Fill Color property, selects the
fill color from a palette. Clicking (Custom
Editor) gives you more choices for colors. See Defining
Colors.
Scalar Function
This type of node is present in the Size Scaling Data and Color Scaling Data nodes.
|
Field Function |
The specific scalar field function to be displayed in the form of size (under the Size Scaling Data node) or color (under the Color Scaling Data node). |
|
|
Units |
Defines the units that are applied to the selected function. |
|