Visualization Workflow
Scenes are the central objects that you use for visualizing results in Simcenter STAR-CCM+. In general, scenes are composed of one or more displayers to which you assign parts or regions for rendering. Each displayer is responsible for rendering solution data, geometry surfaces, or mesh surfaces according to your selections.
-
Create a scene using one of the following methods:
- In the simulation tree, right-click the Scenes node and choose .
- In the Vis toolbar, click (Create/Open Scenes) and choose a scene shortcut from the list.
In either case the items on the list are shortcuts to scenes for a particular purpose. For example, the geometry option creates a scene with a geometry displayer already configured to contain all geometry parts used in the latest available description. If you have not generated the mesh then the displayer contains geometry parts and points to the initial tessellated surfaces for the parts. -
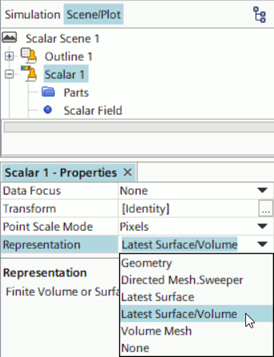
For easier editing of scene controls and properties, click
Scene/Plot at the top of the object tree.
You can switch back to the object tree by clicking Simulation.
-
If the scene has no displayers, or you wish to add an extra displayer,
right-click the [scene] node and choose .
A scene can contain as many displayers as you wish.
-
Set the correct representation from which the visible data, surfaces, or mesh
is taken:

- Select the [displayer] node and set Representation using the drop-down list.
- In the graphics window, right-click in the background and select .
-
Expand the displayer node, select the Parts node, and
proceed to set the parts on which this displayer renders data, surfaces, or
mesh:
- To define a dynamic selection based on queries, click the query editor button.
- To define a static selection using the object selection dialog, click the custom editor button.
For a streamline displayer, you can only choose streamline derived parts. If none are available, switch to the Simulation panel and create a streamline displayer within Derived Parts.
When viewing results of a Lagrangian multiphase simulation, you can add Lagrangian phases as parts within displayers. The size of particles in the scene is governed by the Point Scale Mode property of the displayer and its associated Point Size Scale Field or Point Size nodes (depending on which mode you choose).
-
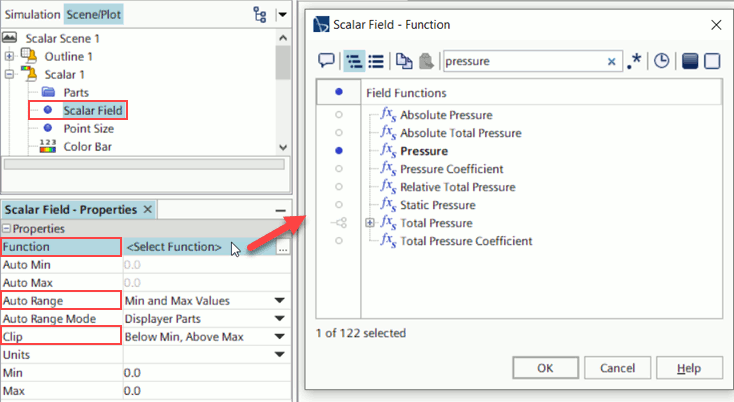
For scalar, vector, or streamline displayers, choose the field function whose
data you wish to view on the chosen Parts:
For scalar or vector displayers, as an alternative to selecting the field function in the object tree, you can click the color bar in the scene and set the field function in the Coloring Properties dialog.
-
For scalar, vector, or streamline displayers, set the color map and related
properties:
-
To control how the displayer renders the scene, select the
[displayer] node and modify the relevant
properties:
- For all displayer types, you can set the Opacity (transparency) with which the displayer renders its parts.
- For scalar displayers, you can choose among different Contour Style options such as Filled, Smooth Filled, Smooth Blended, or others. Automatic is the default option.
- An outline displayer gives you control over which of the following entities to show: mesh lines, outline, feature lines, and surfaces. Activate or deactivate the relevant check boxes.
.mp4) file which
means successive images of a scene are written to the same file. This option is
particularly useful when running transient simulations on a remote
cluster.- To export scene images to file, follow the steps in Saving Scene Images to File.


