Interpreting the Report for a Surface Mesh
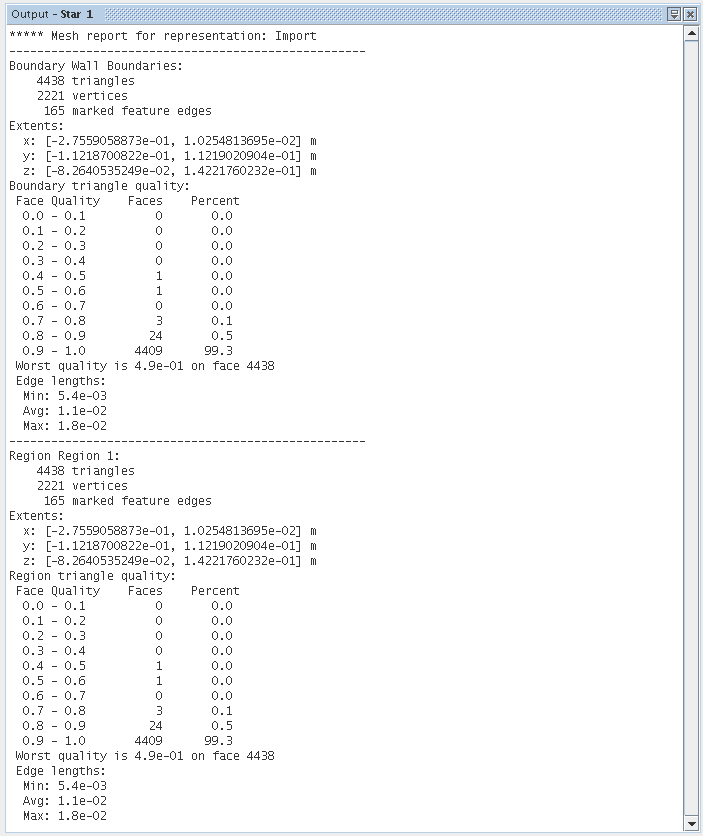
The mesh diagnostics report for any of the surface type representations consists of sections for each boundary and each region.
Each of these sections has subsections for the following:
- Triangles, vertices, and marked feature edges count
- Boundary or region extents
- Boundary or region triangle quality
- Edge length statistics
Triangle quality is listed in 10 separate bands from 0 to 1, with 1 being the best quality. The edge length statistics are useful for gauging initial base values to be used as input for the surface wrapper and/or surface remesher tools.
An example output is shown below:

