Interpreting the Full Report
The full diagnostics report is structured in a similar way to the compact report and contains all the information the compact report produces.
In addition however, the full report accounts for partitioning on a parallel server and includes the following extra items for each region and the overall summary:
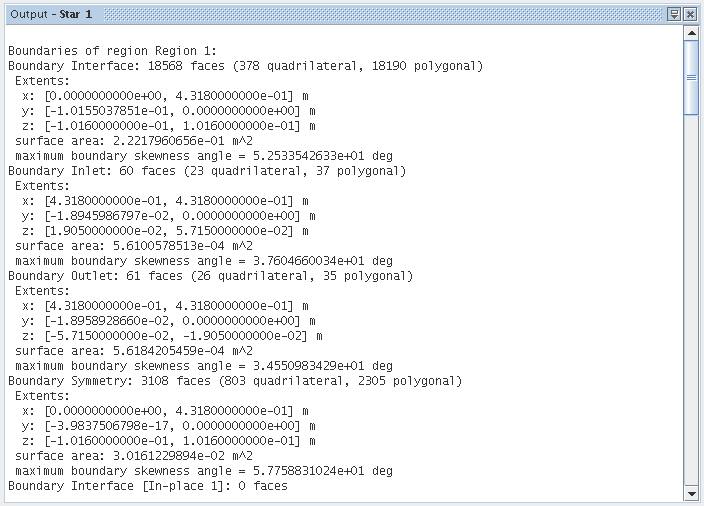
- Boundary details
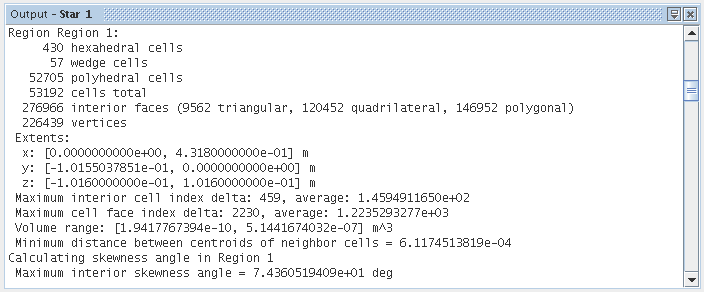
- Entity count per cell shape
- Volume range
- Maximum interior skewness angle
The boundary details can be further split up as follows:
- Number of faces
- Boundary extent
- Surface area
- Maximum boundary skewness angle


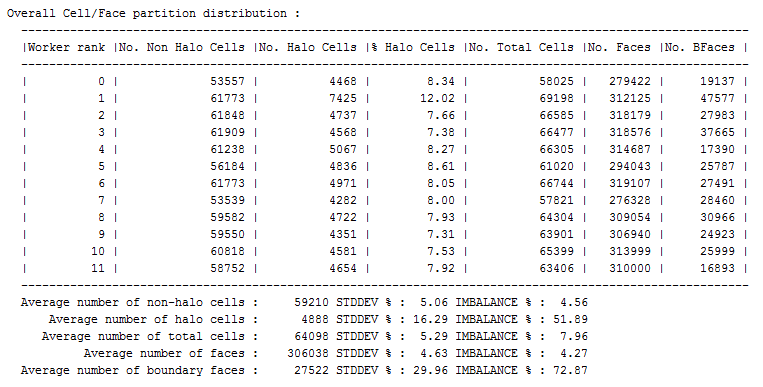
Halo cells and halo faces are duplicate cells and faces on a given partition. These cells and faces are located on that partition's boundary (hence the name, "halo"), and mirror active (non-halo) cells and faces on other partitions. Halo cells are used internally for communicating solution information in the parallel solvers as the solution advances.
The percentage of halo cells and faces relative to total cells and faces is one measure of the resulting communication levels between parallel processes. For example, a mesh with a large percentage of halo cells, (for example, greater than 10%), generally has a higher volume of communication than a comparable mesh size with a lower percentage of halo cells. For multi-region simulations (within the same physics continuum), per-continuum partitioning (the default) generally provides a lower percentage of halo cells than per-region partitioning. Also, small meshes resulting in fewer cells per subdomain or partition generally have a higher percentage of halo elements as they have a higher boundary face to cell ratio.