Visualizing the Solution
Visualize the solution and calculate the stress concentration factor from the computed stress.
-
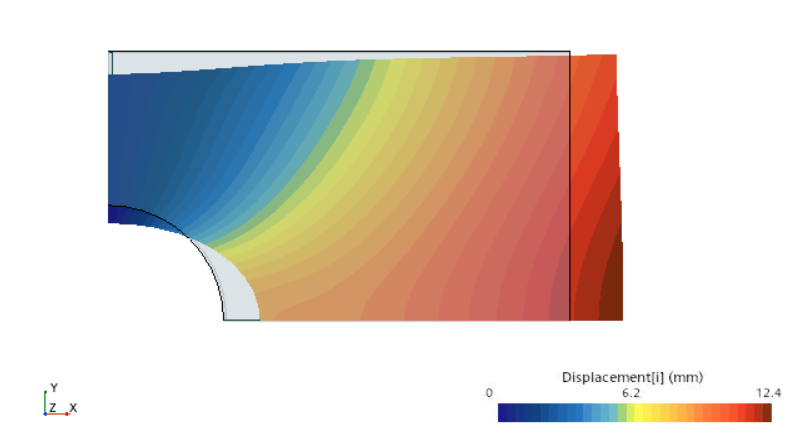
Visualize the computed hoop stress, von Mises stress, and displacement using the scalar scenes that you created for this simulation.
The scenes appear as shown below:
To visualize the applied force and the reaction force:
-
Right-click the
node and select
Run Report.
The report is printed to the Output window. The resultant force is zero.
Run the report for the maximum value of :
-
Right-click the
node and select
Run Report.
A value of is printed to the Output window.
Comparison with Analytical Solution from Roark's formulas
In Roark's formulas [992], the maximum stress is related to the nominal stress through the stress concentration factor :
(5265)
where is the height of the plate quarter, is the hole radius, , and is the input stress, that is, the applied traction load.
The analytical solution therefore gives and .
The maximum computed in Simcenter STAR-CCM+ is , which gives a stress concentration factor of .Note that the stress gradient within the elements at the top of the hole is very high, about 20 %. A better accuracy can be achieved with a finer mesh.