Plotting Fourier Transforms
You can plot a Fourier transform from a monitor containing periodic data.
To plot a Fourier Transform:
- Ensure that the Trigger property of the monitor is set to Time Step.
- Create a Fourier Transform and set its properties.
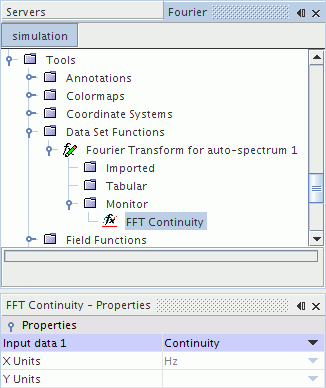
- Right-click the node under this transform and choose .
-
Give the derived monitor a meaningful name and in the derived monitor
Properties window, assign the
Input data 1 property to the monitor containing the periodic data.

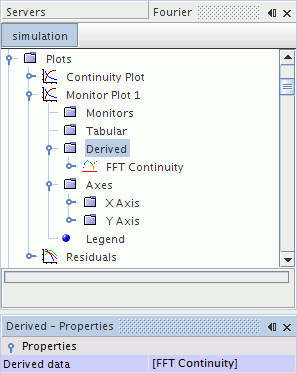
- Create a monitor plot after the simulation has run.
-
Click the
node under this monitor plot, and in the
Properties window, select the derived data monitor to assign it to the
Derived data property.

-
Double-click the monitor plot node to display the Fourier Transform plot.
