Setting Up Evaporation Rate Reports, Monitors, and Plots
Set up reports, monitors, and plots to monitor the film evaporation rate along the fluid film boundary.
To set up evaporation rate reports, monitors, and plots:
- Right-click the Reports node and select .
- Rename the newly created Surface Average 1 node to H2O Evaporation Rate.
- Set the Scalar Field Function to .
- Click the ellipsis to the right of the Parts property.
-
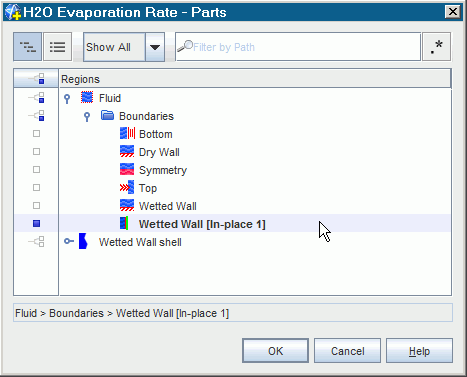
In the dialog that appears, expand the
node and select
Wetted Wall [In-place 1].

- Click OK.
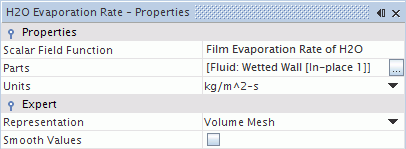
The H2O Evaporation Rate - Properties window looks as follows:

Copy this report to create a second one for the ethylene glycol evaporation rate:
- Right-click and select Copy.
- Right-click Reports and select Paste.
- Select the copy and rename it to C2H6O2 Evaporation Rate.
- Select and, set the Scalar Field Function to .
Create a monitor and a plot for both reports.
-
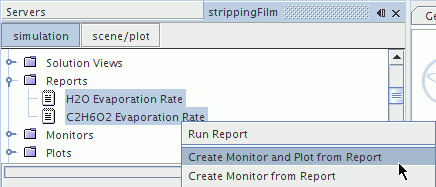
Select both the
H2O Evaporation Rate and
C2H6O2 Evaporation Rate nodes, right-click either and select
Create Monitor and Plot from Report.

- Click Single Plot to display both evaporation rates on the same plot.
Set the monitors to update at each time step:
-
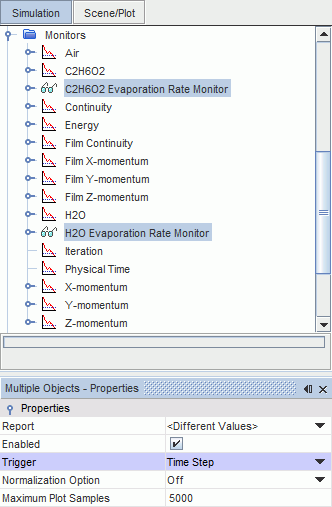
Select both the
and the
H2O Evaporation Rate Monitor nodes, and set
Trigger to
Time Step.

Format the monitor plot appearance:
- Rename to Evaporation Rates.
- Right-click the node and select Open.
- Select and set the Title to Time (s).
- Select and set the Title to Surface Average of Film Evaporation Rate (kg/m^2-s).