Visualizing the Mesh Sensitivity
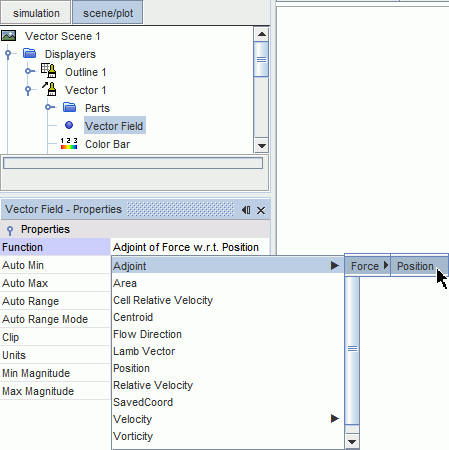
After computing mesh sensitivity, you obtain for each cost function one vector field function Adjoint of [cost function] w.r.t Postion.
To visualize the mesh sensitivity:
- Create a vector scene.
- Click the scene/plot button.
- In the vector scene, select the node.
-
In the
Properties window, set
Function to the appropriate
Adjoint of [cost function] w.r.t Postion.
