Creating Threshold XY Plots
A XY scatter plot of the cell or boundary thresholds against the pro-STAR cell index can be made in order to visualize the distribution of cell quality in the mesh.
An appropriate cell metric or boundary metric based threshold must be made first before you can analyze the bad cells in the mesh.
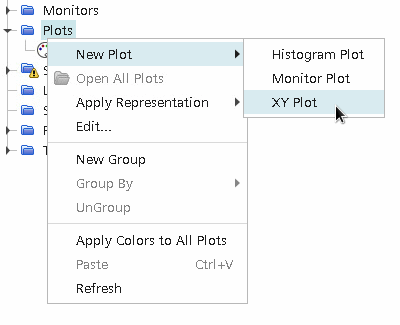
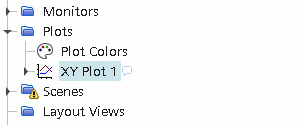
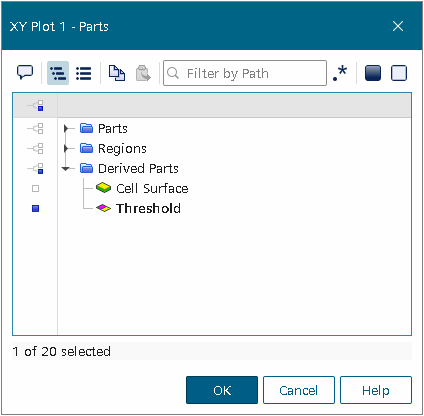
To close the editor, press the OK button. The cells in the threshold part are used as the basis to extract data for the XY plot, which means that only data for the bad cells are shown. Next, set the properties for the X and Y axes, both of which use scalars.
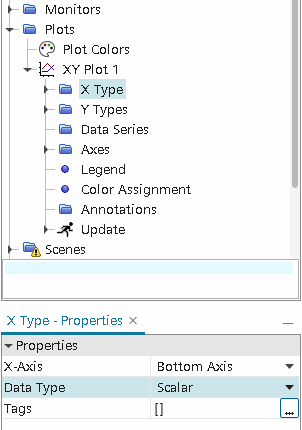
Setting the Type to be a scalar, allows the use of pro-STAR cell index numbers for the X-axis. Open the X Type node and click the Scalar node underneath. In the Properties window for the node, set Scalar to be Prostar Cell Id by using the pull-down menu.
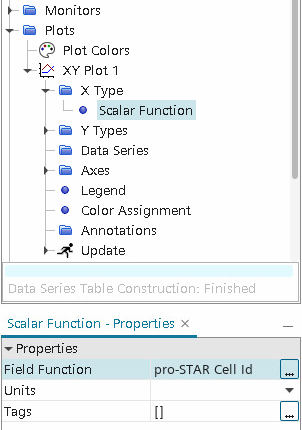
The X-axis of the plot then uses the pro-STAR cell index values from the threshold part, which are typically anywhere in the range of 1 to the highest cell number in the mesh.
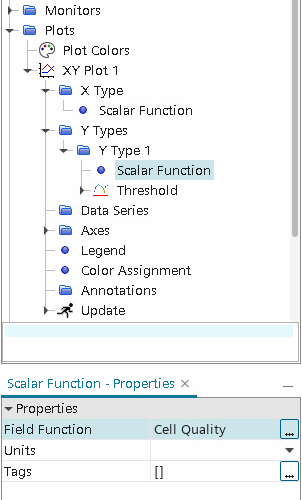
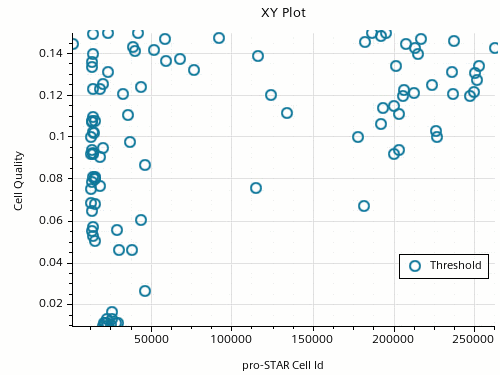
The original derived part threshold properties can be used to control the number of cells and range that are used in the graph. The plot is useful to determine clustering or banding of data points for different cell and boundary metrics for the mesh.