Identification And Visualization Based On Boundary Metrics
Boundary metrics can be used to identify bad cells on the boundaries.
This technique is applicable for finding boundary cells which have:
- zero area faces; and
- poor boundary skewness angles;
To identify the boundary surfaces using the boundary metrics that are listed above, follow the same procedure that was used for identifying and visualizing cells using cell metrics. However, for the Input Parts list in the Create Threshold dialog, select the desired boundaries instead of regions to operate on in the Select Objects editor. Additionally, to check for zero-area faces, use the Area: Magnitude option for Scalar.
This results in the threshold boundary surfaces being displayed at the end. However, this type of display is limited for the following reasons:
- Displaying the value of the scalar quantity on the boundary does not indicate the shape of the cell.
- If the quantity of interest is the face area magnitude and the face areas are almost zero, then the polygon representing the face is typically hard to locate and view.
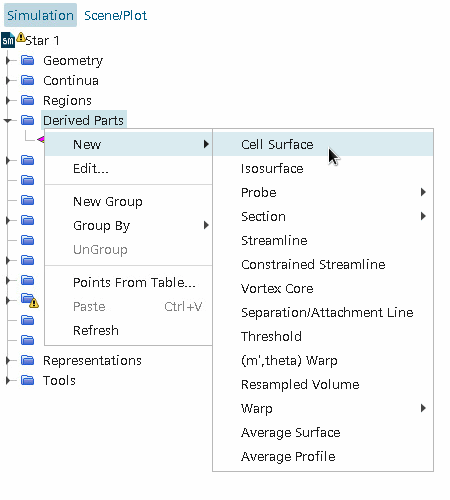
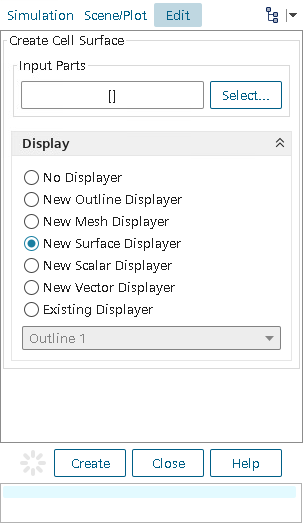
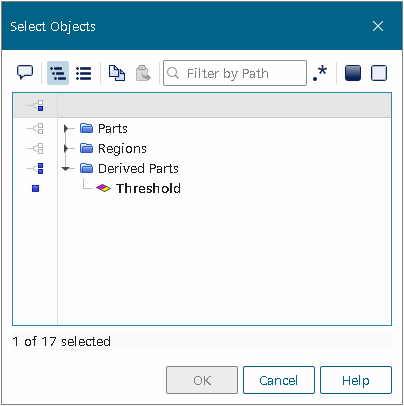
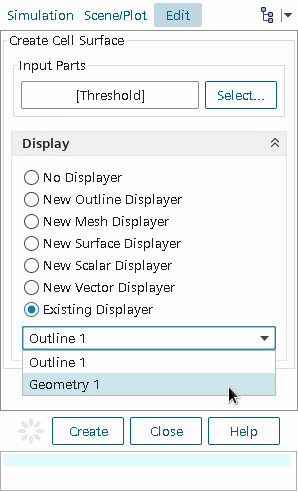
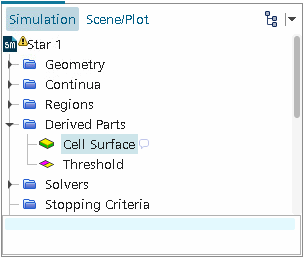
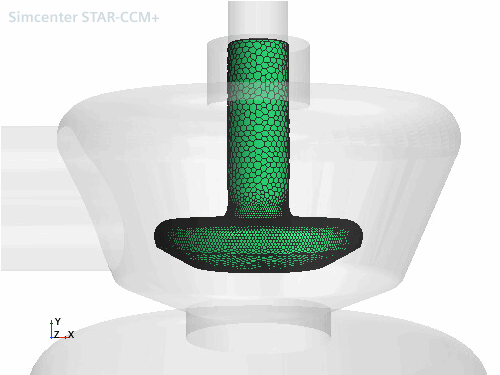
The full shape of the boundary cells can now be seen and inspected further by using the normal zoom, translate, and rotate options.