Setting a Two-Dimensional Plot of the Transform Using a Frequency Band
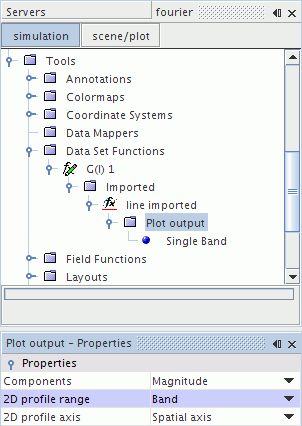
You can use a frequency band to plot a Line Time Fourier Transform or a Line Spatial Fourier Transform in two-dimensions.
To plot a Line Time Fourier Transform or a Line Spatial Fourier Transform:
-
Select the
and set its
2D profile range to
.

The
node appears as a child node of
.


-
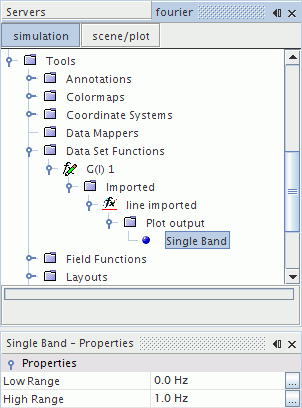
Select the
node and set its
Value to the required frequency.
Single Band Properties
Low Range
The value of the lowest frequency for which the Fourier transform is plotted in two dimensions.
High Range
The value of the highest frequency for which the Fourier transform is plotted in two dimensions.
Clicking the
 property customizer button activates a property customizer that lets you specify both the frequency value and the appropriate time units (/s or
Hz).