Analyzing Topology Optimization Results
You can follow the progress of the solution using the material indicator scene that you created previously.
The following screenshot shows the material indicator distribution and the plots after 300 optimization iterations:
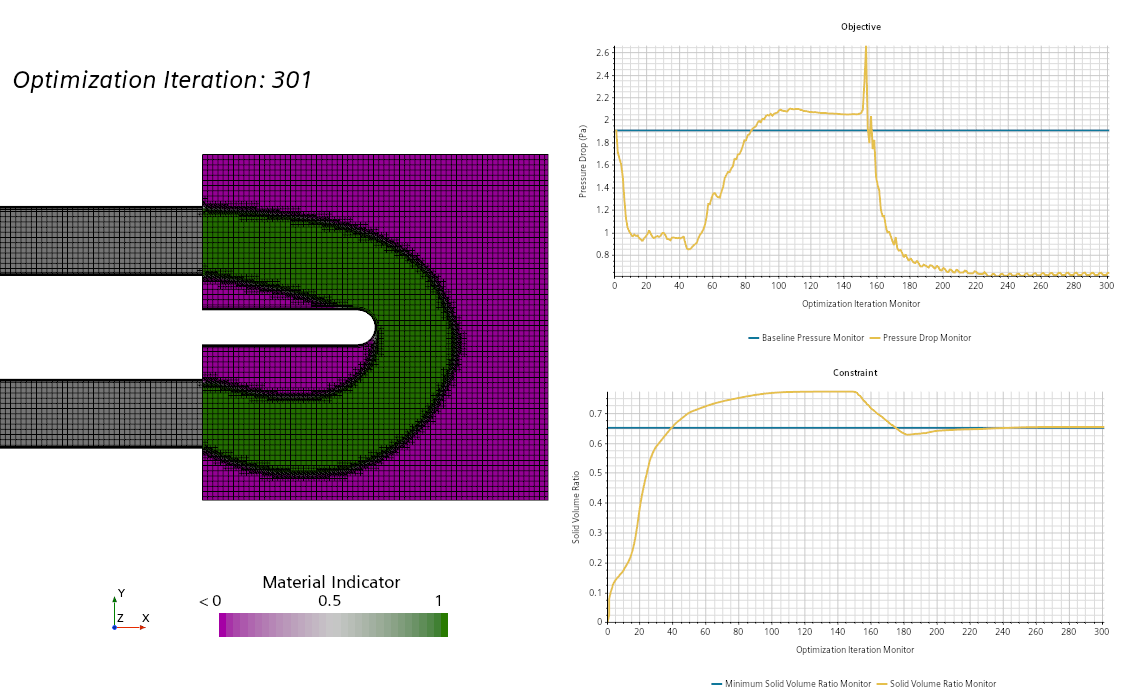
In the material indicator scene, the computed optimized path of the flow is represented by a material indicator value of 1. This topology is embedded into the green solid material denoted by a material indicator value of 0. The topology connects the inlet and the outlet channel around the U-bend geometry that widens at the lower curve. Qualitatively, this flow channel looks acceptable.
In the objective plot, you see that at first the pressure drop varies significantly over the optimization iterations while the algorithm is iterating to meet the objective and the constraint. Then the pressure drop approaches and settles on a constant value around 0.63 Pa. The design objective is met in that this pressure drop value is lower than the baseline pressure drop (given by the blue line).
The constraint plots shows the evolution of the volume ratio constraint against optimization iteration. The volume ratio increases steadily, that is, the fraction of solid material in the domain grows, but to no more than a value of 0. 65 at the end of the simulation.