Plotting Variable Material Properties
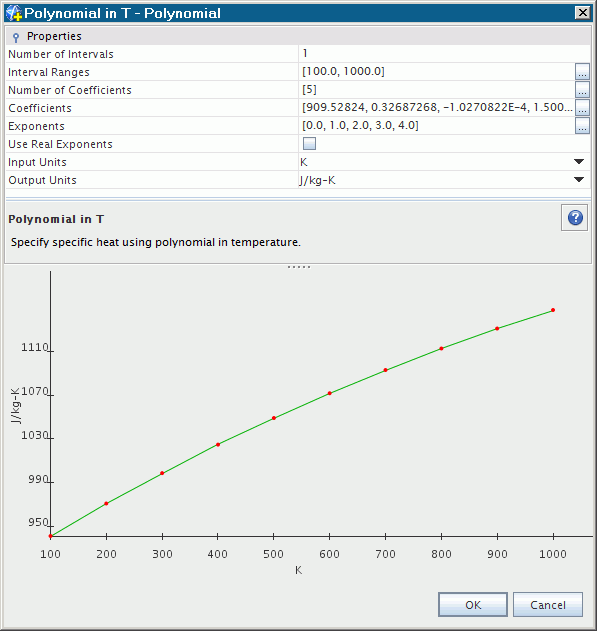
When you work with a material property that uses a polynomial function, you can generate an approximate plot preview of the values before you run the simulation.
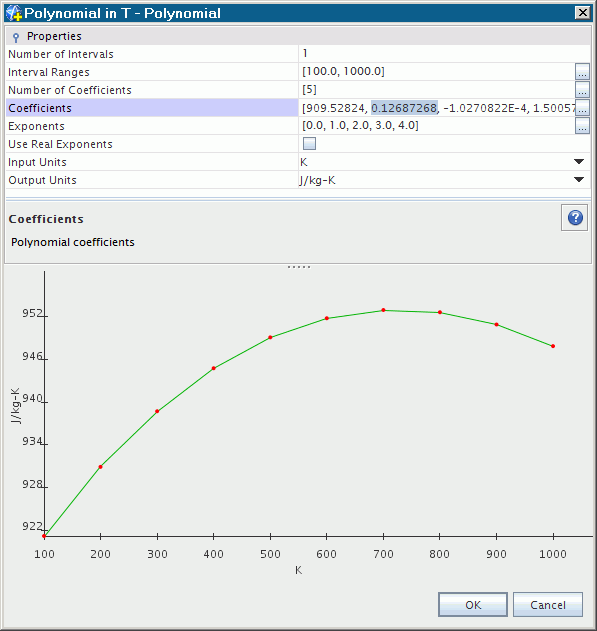
The “pre-processing check” lets you verify that you have entered the values correctly, or otherwise observe the behavior of the polynomial.
To generate the plot preview:
- Select the node of a material property polynomial method. An example of such a node would be .
- Click
 (Custom Editor) in the Polynomial property.
A customizer dialog that includes a graph opens.

As you modify the values, the graph changes in response to your entries.

You can also choose units. The Input Units property specifies units for the x-axis, while the Output Units property does so for the y-axis. Unlike constant values, the polynomial coefficients and polynomial ranges (and so x- and y-axes on the polynomial plot) do not rescale when you change the units. These unit selections serve as an indicator of the units that Simcenter STAR-CCM+ uses when calculating quantities with this polynomial.